San Francisco — In the fast-evolving landscape of edge artificial intelligence, efficiency is the ultimate currency. As machine learning models grow increasingly sophisticated, deploying them on resource-constrained edge hardware—such as smartphones, Internet of Things (IoT) devices, and microcontrollers—requires razor-thin margins of resource consumption.
TensorFlowLite (TFLite), Google’s lightweight framework tailored for on-device machine learning, has long been a developer favorite for its low-latency execution and minimal memory footprint. Central to its success is its "memory arena," an ingenious architectural component that minimizes overall memory usage by dynamically sharing buffers among disparate tensors.
However, achieving ultra-low memory consumption historically came with a hidden tax: runtime overhead during initialization and memory allocation. In a recent engineering deep dive, software engineer Alan Kelly detailed a massive, methodical performance optimization campaign targeting TFLite’s memory arena initialization. By leveraging advanced profiling tools like Android’s Simpleperf, the TensorFlow team slashed memory allocation overhead by dramatic margins, fundamentally shifting where execution time is spent during neural network inference.
The optimized memory arena is now publicly available as part of TensorFlow 2.13, promising smoother, faster on-device machine learning pipelines for developers worldwide.
Main Facts: The Anatomy of a Breakthrough
The Problem: In models featuring variable input sizes and dynamic tensors—where output dimensions remain unknown until runtime operator evaluation—frequent tensor re-allocations can cause memory arena overhead to skyrocket. In worst-case scenarios, initialization functions like ArenaPlanner::ExecuteAllocations consumed over 54% of total model runtime.
The Solution: Through rigorous profiling, Google engineers identified and resolved multiple hidden bottlenecks, including redundant virtual function calls, inefficient data structures, and $O(N^2)$ deallocation complexities.
The Tools: Engineers utilized Android Simpleperf for on-device performance profiling, Google pprof for visualization (specifically flame graphs), and the Android NDK command-line utilities.
The Impact: The comprehensive overhaul reduced overall model runtime by 25% in heavy workloads, cut memory allocator overhead by half, and shifted bottlenecks away from runtime management and back onto the actual neural network operators (such as fully connected layers and convolutions), exactly where they belong.
Chronology of an Optimization Campaign
To understand how the TensorFlow team achieved these performance gains, one must examine the chronological progression of the profiling and refactoring process.
Phase 1: Establishing the Baseline and Discovering the Bottleneck
When deploying machine learning models on edge devices, performance engineers typically expect the heaviest resource consumption to stem from compute-heavy ML operators, such as matrix multiplications, convolutions, or fully connected layers.
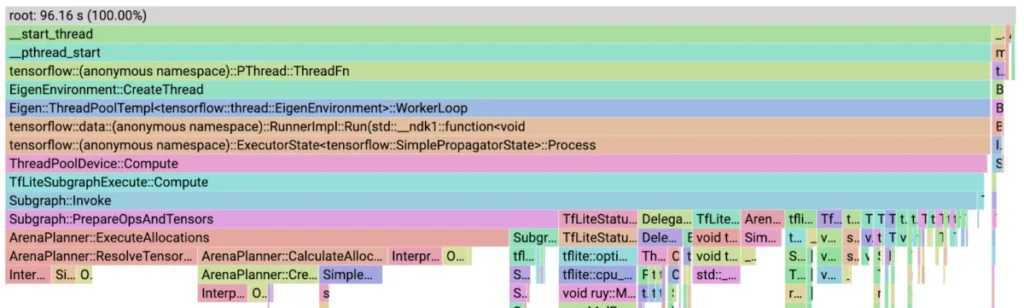
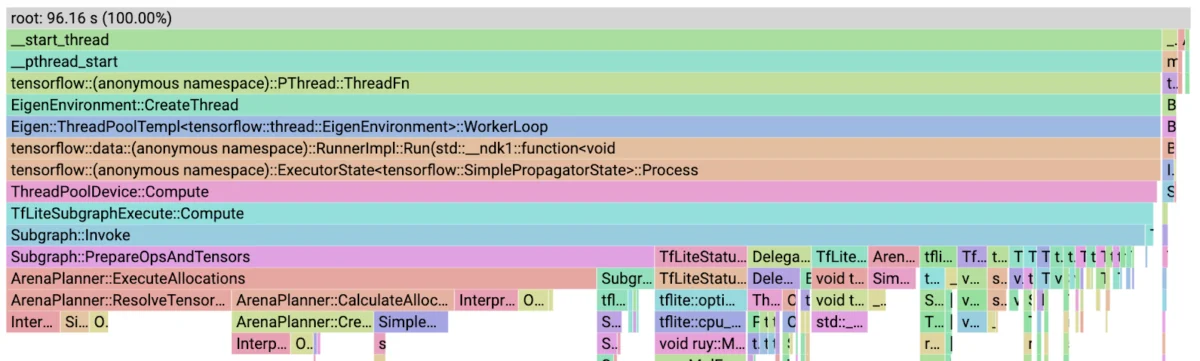
However, when profiling a challenging model featuring dynamic tensors and variable inputs, Kelly and his team discovered an alarming anomaly. Flame graphs generated via Simpleperf revealed that ArenaPlanner::ExecuteAllocations accounted for an astonishing 54.3% of the model’s total runtime.
To track this down, developers followed a strict workflow using the Android NDK and Simpleperf:
Pushing and Recording: Using run_simpleperf_on_device.py record --call-graph fp /data/local/tmp/my_binary arg0 arg1, engineers captured performance counters and generated a raw perf.data file.
Building the Cache & Proto: Pulling the data back via adb pull and utilizing binary_cache_builder.py alongside pprof_proto_generator.py prepared the data for visual inspection.
Visualization: Running pprof -http :8888 profile.proto allowed engineers to inspect interactive flame graphs at localhost:8888.
Phase 2: Eliminating Redundant Virtual Calls
Zooming into the profile of ArenaPlanner::ExecuteAllocations, the team uncovered a surprising culprit: InterpreterInfo::num_tensors() accounted for 10.4% of the total runtime.
Because num_tensors() was a virtual function executing inside a tight evaluation loop, and because it internally called yet another function, it accumulated massive CPU cycles:
for (int i = 0; i < static_cast<int>(graph_info_->num_tensors()); ++i)
  // ...
Because the arena planner neither creates nor destroys tensors during this phase, the total number of tensors remains strictly constant. Engineers cached this value prior to entering the loop:
const int num_tensors = static_cast<int>(graph_info_->num_tensors());
for (int i = 0; i < num_tensors; ++i)
  // ...
Combined with a secondary fix for InterpreterInfo::tensor(unsigned long)—replacing another virtual bounds-checking function with a direct pointer to the underlying tensor array—these initial, surgical code changes slashed the model’s overall runtime by 25% and cut memory allocator overhead in half.
Phase 3: Streamlining Tensor Allocation Vectors
With the initial low-hanging fruit harvested, the team conducted a follow-up profile. ArenaPlanner::CalculateAllocations emerged as the new leading bottleneck, consuming 12.7% of runtime. This function relied on ArenaPlanner::CreateTensorAllocationVector, which identifies which tensors require allocation between specific nodes in the execution graph and sorts them by size (utilizing a Greedy-by-Size allocation strategy).
Because the underlying graph structure is fundamentally constant, engineers replaced the exhaustive per-node tensor search with a pre-computed map of tensors allocated at each node. This brought the cost of ArenaPlanner::CreateTensorAllocationVector plummeting from 4.8% down to just 0.8% of total runtime.
Phase 4: Resolving Pointer Resets and Deallocation Complexities
Next up was ArenaPlanner::ResolveTensorAllocation, responsible for resetting individual tensor data pointers post-allocation (accounting for 10.9% of runtime). Recognizing that these pointers do not change on every single pass, the team implemented a tracking mechanism to update only the modified pointers, causing ResolveTensorAllocation to vanish from the performance profile entirely.
Deallocation presented an even thornier architectural puzzle. SimpleMemoryArena::Allocate and SimpleMemoryArena::Deallocate each consumed roughly 7% of runtime. Initially, allocations were stored in a vector ordered by arena offsets, making insertions, removals, and searches $O(N)$ operations.
Faced with this, engineers briefly tested replacing the vector with an std::multimap for $O(log N)$ insertions and deletions. Counter-intuitively, the multimap implementation made the code nearly three times slower than the vector.
“While this goes against intuition, this is commonly found when optimizing code,” Kelly noted. “Operations on a set or a map have linear or logarithmic complexities, however, there is also a constant value in the complexity. This value is higher than the constant value for the complexity of a vector.”
Instead of switching data structures, the team optimized the vector approach. By replacing frequent individual erasures (std::vector::erase)—which triggered heavy memcpy penalties—with batch removals via std::remove_if, and introducing SimpleMemoryArena::DeallocateAfter(int32_t node), deallocation complexity was reduced to $O(N)$ in a single pass.
Phase 5: Purging Inactive Records
The final frontier was SimpleMemoryArena::Allocate, which still suffered from an inherent $O(N^2)$ limitation characteristic of Greedy-by-Size algorithms. To mitigate this without abandoning the memory-efficient algorithm, engineers introduced a purging mechanism. Because execution proceeds sequentially through nodes, records belonging to tensors already deallocated on past nodes are no longer needed. By periodically purging inactive records, N was drastically reduced on large models.
Supporting Data: Before and After
The compounding impact of these architectural refinements transformed the TFLite runtime profile:
Initial State:ArenaPlanner::ExecuteAllocations dominated 54.3% of total model execution time, with memory allocation overhead peaking near 49.9%.
Intermediate Milestones: Caching num_tensors() and optimizing tensor vectors reduced model runtime by 25%. Streamlining allocation vectors cut specific sub-routine costs from 4.8% to 0.8%.
Final State: Following the elimination of redundant pointer resets and the introduction of batch-deallocation and record purging, memory allocation overhead dropped from nearly 50% down to a lean 6%.
Crucially, the top of the performance profile shifted away from internal memory management routines and onto core neural network operators—such as fully connected layers—signifying a healthy, uninhibited inference pipeline.
Official Responses and Engineering Philosophy
Google’s engineering culture emphasizes that hardware-software co-design requires rigorous, data-driven visibility rather than speculative code assumptions.
"This is a particularly bad case; the memory arena overhead isn’t this bad for every model, but improvements here will impact all models," Kelly emphasized in the official TensorFlow blog release. "I would never have suspected this… Simpleperf made identifying these inefficiencies easy!"
By open-sourcing these improvements directly into the core framework codebase via commits ranging from tensor pointer caching to batch-deallocation algorithms, Google has reinforced its commitment to transparent, high-performance edge computing.
Implications for the Edge AI Ecosystem
The implications of the TensorFlow 2.13 memory arena updates extend far beyond minor benchmark improvements. As generative AI, computer vision, and natural language processing models migrate aggressively from cloud datacenters onto consumer hardware (such as Android smartphones, automated vehicles, and smart home appliances), efficiency directly correlates with user experience.
Extended Battery Life: By eliminating redundant CPU cycles spent on memory management and pointer re-allocations, processors spend less active time churning through overhead, directly reducing thermal output and preserving battery life on mobile devices.
Lower Latency for Dynamic Models: Applications relying on variable input sizes—such as real-time video streaming, object tracking, and speech recognition—will experience smoother, more predictable frame rates and response times.
Democratization of Profiling Tools: By explicitly detailing how to leverage Android Simpleperf and Google pprof within the context of TensorFlow, Google has empowered the broader developer community to conduct professional-grade performance auditing on their own custom edge applications.
Ultimately, TensorFlow 2.13 proves that even mature, highly optimized machine learning frameworks retain deep reservoirs of hidden performance—waiting only to be unlocked by the right combination of profiling telemetry and algorithmic intuition.