SAN FRANCISCO — In the high-stakes world of on-device machine learning (ML), every millisecond and every megabyte counts. As developers increasingly push complex artificial intelligence models onto resource-constrained edge devices—ranging from smartphones and smartwatches to Internet of Things (IoT) hardware—efficiency has transformed from a desirable feature into an absolute necessity.
TensorFlowLite (TFLite), Google’s lightweight framework specifically engineered for mobile and embedded devices, has long been a favorite tool for developers seeking low-latency inference. A cornerstone of TFLite’s memory-saving architecture is its innovative "memory arena," a mechanism that minimizes memory footprints by intelligently sharing buffers among tensors.
However, achieving high efficiency often introduces hidden computational costs. Recently, a deep-dive engineering effort led by Software Engineer Alan Kelly uncovered that initialization and management overhead within the TFLite memory arena could occasionally create severe performance bottlenecks. Through meticulous profiling using Android’s Simpleperf tool and subsequent codebase overhauls, the TensorFlow team managed to slice total model runtime by 25% and slash memory allocator overhead in half. This optimization is now publicly available in TensorFlow 2.13, promising smoother, faster on-device AI deployments worldwide.
Main Facts: The Anatomy of a Bottleneck
When deploying machine learning models on edge hardware, developers typically analyze performance by looking at neural network operators—such as convolutions, pooling layers, and fully connected matrices. Conventional wisdom dictates that these heavy mathematical operations consume the vast majority of a model’s execution time.
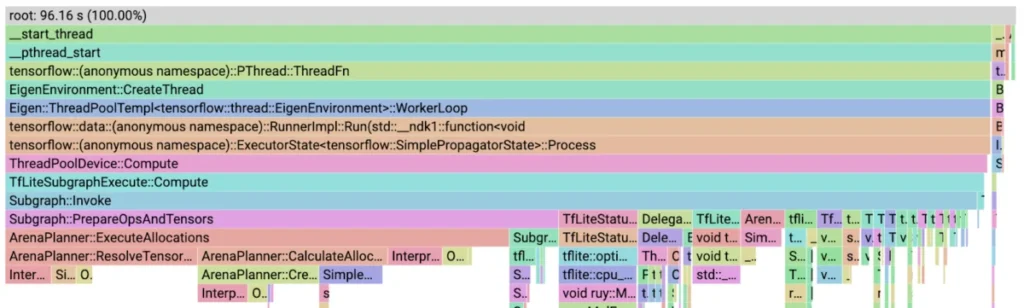
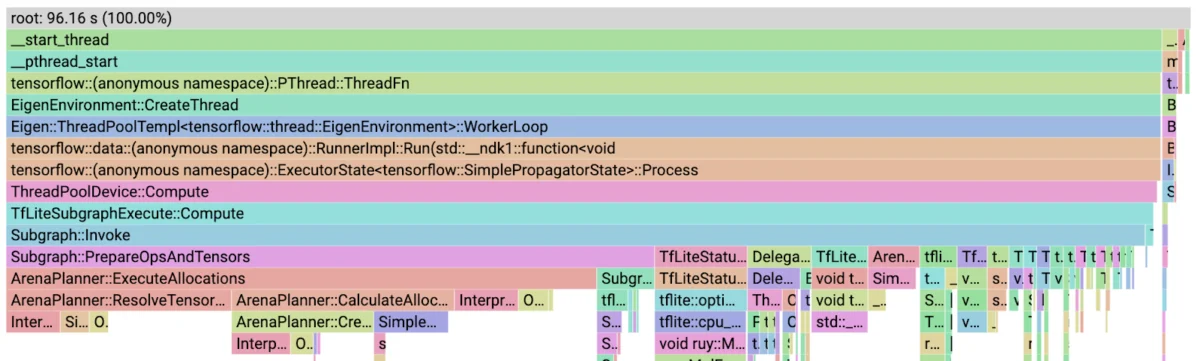
However, Kelly’s investigation revealed a shocking counter-example. In models characterized by variable input sizes and dynamic tensors—where output sizes remain unknown until operator evaluation occurs—frequent tensor re-allocations are triggered. Under these extreme test conditions, a single function, ArenaPlanner::ExecuteAllocations, accounted for a staggering 54.3% of the model’s total runtime.
Rather than the heavy lifting of the neural network operators being the primary consumer of processing power, the runtime infrastructure itself was bogging down the device. By leveraging Simpleperf—a native profiling tool built into the Android NDK—the TensorFlow engineering team exposed a series of subtle inefficiencies hidden deep within virtual function calls, cache-unfriendly data structures, and suboptimal deallocation routines.
Chronology: Step-by-Step Optimization of the Memory Arena
The journey to a lean, highly optimized memory arena was not achieved through a single massive rewrite, but rather through a systematic, data-driven sequence of profiling, identification, and surgical code refactoring.
Phase 1: Uncovering Low-Hanging Fruit
Armed with Simpleperf, the team captured performance data on target Android devices, pulling the resulting perf.data back to a workstation to generate protocol buffers consumable by Google’s pprof visualization tool.
Initial flame graphs pointed directly to ArenaPlanner::ExecuteAllocations. Zooming in further, the profiler isolated InterpreterInfo::num_tensors(), which consumed 10.4% of total runtime.
The Problem:num_tensors() was implemented as a virtual function that called another function inside a loop evaluating every tensor. Because the number of tensors in the graph remains constant during execution, calling this virtual function repeatedly was entirely redundant.
The Fix: The team cached the tensor count prior to entering the loop:
const int num_tensors = static_cast<int>(graph_info_->num_tensors());
for (int i = 0; i < num_tensors; ++i)  /* ... */
The Next Target: Next up was InterpreterInfo::tensor(unsigned long), another virtual function executing bounds checking before returning a pointer. Because tensors are inherently stored sequentially in an array, the team introduced a direct accessor method to bypass the virtual call overhead entirely (referenced in commits 7528df8 and 91cc89a).
These two straightforward modifications immediately dropped overall model runtime by 25% and cut memory allocator overhead in half.
Phase 2: Refining Allocation Vectors and Resolution
With the initial roadblocks cleared, a new profile revealed that ArenaPlanner::CalculateAllocations had stepped up to become the most expensive function, taking 12.7% of runtime. This function relied on ArenaPlanner::CreateTensorAllocationVector, which identifies which tensors require allocation between two nodes in the graph and sorts them by size (utilizing a Greedy-by-Size allocation strategy).
The Optimization: Because the structural layout of a static inference graph is constant, the team replaced the dynamic per-node search with a pre-computed map of tensors allocated at each node. This eliminated redundant checks, reducing the cost of CreateTensorAllocationVector from 4.8% down to a negligible 0.8% (Commit 72c981e).
Attention then shifted to ArenaPlanner::ResolveTensorAllocation (consuming 10.9% of runtime), which blindly reset every tensor’s data pointer after allocation, even when those pointers hadn’t changed. By tracking pointer state changes and updating only modified tensors (Commit c9b8216), this function vanished from the profile entirely.
Phase 3: Tackling Allocation and Deallocation Complexities
The remaining culprits were SimpleMemoryArena::Allocate and SimpleMemoryArena::Deallocate, consuming roughly 7% and 6.8% of runtime respectively.
Engineers initially hypothesized that replacing the underlying std::vector—which has $O(N)$ insertion, removal, and search complexities—with an std::multimap or std::list would improve performance. However, practical testing proved counterintuitive. While maps and lists offer logarithmic $O(log N)$ or constant insertion times, their higher constant factor overheads and poor cache locality during sequential iteration made them nearly three times slower than a vector.
Instead, the team optimized deallocation by addressing how elements were erased:
The Deallocation Fix: Frequent calls to std::vector::erase inside loops triggered expensive memcpy operations, resulting in an atrocious $O(N^2)$ complexity. The team refactored this process to mark records for deletion and purge them in a single pass using std::remove_if. Furthermore, they introduced SimpleMemoryArena::DeallocateAfter(int32_t node) to cleanly drop tensor records past a specific execution node in a single linear sweep (Commits 509b811 and 9e582c0).
Finally, to address the remaining $O(N^2)$ bottleneck inside SimpleMemoryArena::Allocate, engineers implemented a purging mechanism. Because execution flows sequentially through graph nodes, allocation records for tensors deallocated on past nodes are no longer required. Purging these stale entries shrinks $N$ significantly for large models during runtime.
Supporting Data: Profiling Metrics at a Glance
Optimization Stage
Primary Bottleneck Identified
Initial Runtime Impact
Final Metric / Result
Baseline
ArenaPlanner::ExecuteAllocations
54.3% of total model runtime
Severe overhead due to dynamic tensor re-allocations.
Phase 1
Virtual functions (num_tensors, tensor)
10.4% spent on redundant calls
Caching tensor counts reduced total runtime by 25% and halved allocator overhead.
Pre-computed tensor maps and conditional pointer resets dropped these functions from profiles.
Phase 3
SimpleMemoryArena::Allocate / Deallocate
~14% combined
Replaced $O(N^2)$ vector erasures with single-pass std::remove_if and stale record purging.
Final State
Fully Connected & Conv Operators
<6% memory overhead
Runtime profile successfully restored to standard neural network operator distribution.
Official Responses and Engineering Philosophy
Reflecting on the optimization process, the TensorFlow engineering team emphasized that theoretical algorithmic complexity does not always translate cleanly to real-world hardware execution.
"While this goes against intuition, this is commonly found when optimizing code," noted Alan Kelly in the technical release. "Operations on a set or a map have linear or logarithmic complexities, however, there is also a constant value in the complexity. This value is higher than the constant value for the complexity of a vector. We also iterate through the records, which is much cheaper for a vector than for a list or multimap."
By refusing to rely on assumptions and instead utilizing on-device profiling with Simpleperf, the team demonstrated the profound value of empirical performance engineering. Code inspection alone would never have flagged virtual function overhead hidden inside inner loops or the nuanced cache-locality advantages of simple vectors over complex associative containers.
Implications for Developers and the Edge AI Ecosystem
The successful overhaul of the TFLite memory arena carries broad implications for the broader mobile and edge computing community:
Lower Battery Drain and Heat: By reducing runtime overhead by up to 25%, edge devices expend significantly less CPU cycles on administrative memory chores. This translates directly to lower power consumption, reduced thermal throttling, and improved battery life for end-users running on-device AI features.
Better Support for Dynamic Models: Models featuring variable input sizes and dynamic shapes—common in modern natural language processing, speech recognition, and real-time computer vision pipelines—historically suffered the most from memory arena inefficiencies. These updates make complex, dynamic architectures far more viable for mobile deployment.
Open Access via TensorFlow 2.13: Developers do not need to rewrite their models to reap these benefits. The optimized memory arena is now fully integrated into TensorFlow 2.13, meaning existing TFLite applications will automatically experience performance gains upon upgrading.
A Blueprint for Profiling: The detailed instructions provided by the TensorFlow team regarding Simpleperf, binary cache building, protocol buffer generation, and flame graph visualization (pprof) serve as a masterclass for systems engineers seeking to diagnose and resolve bottlenecks in their own native mobile applications.
Ultimately, this engineering milestone underscores Google’s ongoing commitment to making TensorFlow Lite the premier framework for high-performance, low-overhead machine learning at the edge.