Demystifying Machine Learning Models: TensorFlow and Google Release New Guide on Advanced Decision Tree Visualization
MOUNTAIN VIEW, Calif. — In the realm of predictive analytics and tabular data modeling, decision trees remain a foundational cornerstone. Serving as the basic structural units for powerful machine learning frameworks like Random Forests and Gradient Boosted Trees, these models are heavily relied upon across industries—from finance and healthcare to environmental science and retail. However, despite their widespread adoption, interpreting why a model arrives at a specific conclusion has historically felt like peering into a black box.
To bridge this critical gap between model performance and human interpretability, Google and the TensorFlow team have officially published a comprehensive new tutorial. Authored by Terence Parr of Google, the guide showcases how developers, data scientists, and researchers can leverage dtreeviz—widely recognized as a state-of-the-art visualization library—to render, interpret, and debug TensorFlow Decision Forest Trees with unprecedented clarity.
Main Facts: Unlocking the Black Box of Machine Learning
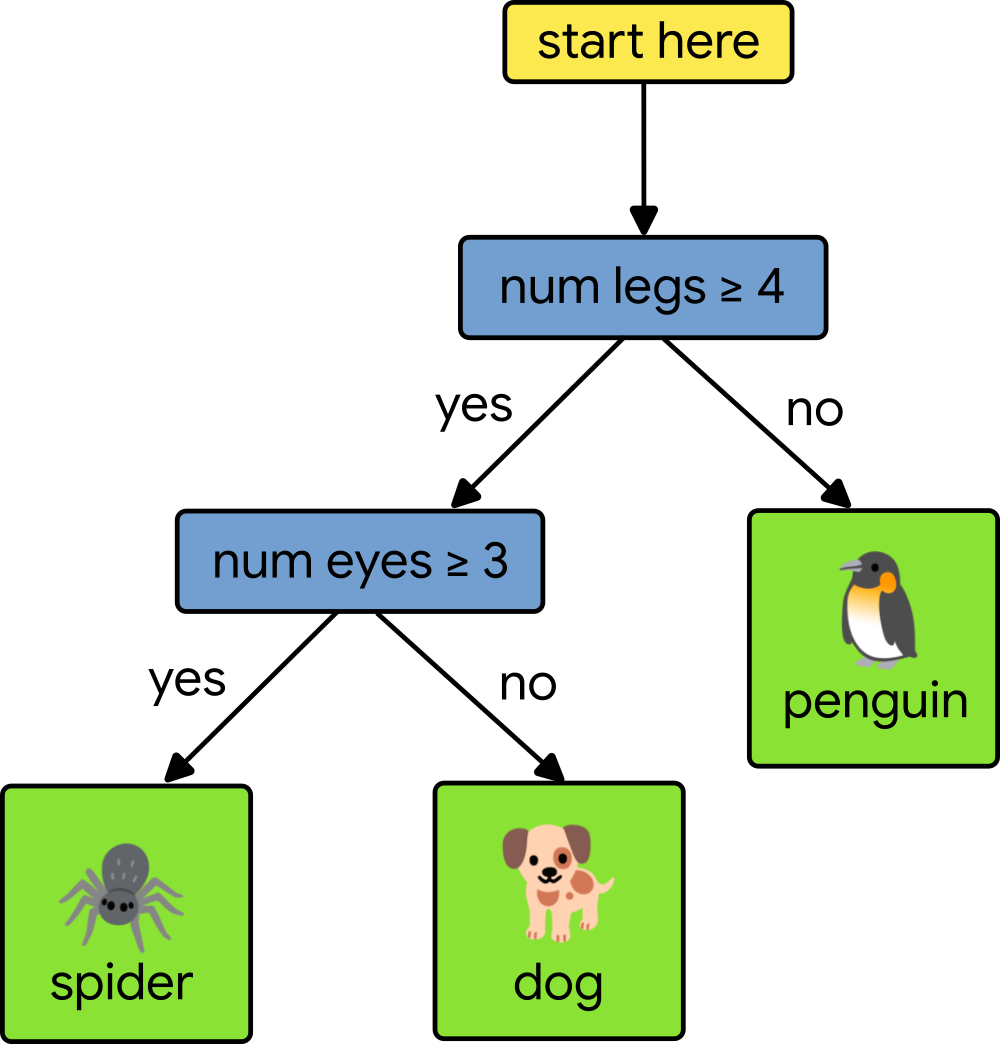
At its core, a decision tree is a supervised machine learning model that learns the intricate relationships between observations and target values by distilling complex training datasets into hierarchical, binary structures.

- Classification vs. Regression: In classification tasks, decision trees sort data into discrete categories (such as diagnosing whether a medical scan indicates cancer or a healthy tissue sample). In regression tasks, they predict continuous numerical values, such as estimating real estate prices or physical measurements.
- The Mechanics of Decision Nodes: Every path from the root of a decision tree to a terminal leaf node passes through a sequence of internal decision nodes. Each node evaluates a single feature against a specific split-point value learned during the training phase.
- The Visualization Breakthrough: While traditional visual representations of decision trees often display plain, text-heavy diagrams that lack contextual depth, the dtreeviz library provides rich, highly informative graphics. It visualizes how individual decision nodes partition feature spaces and clearly illustrates the distribution of training instances contained within each leaf.
By integrating TensorFlow Decision Forests with dtreeviz, practitioners no longer have to rely purely on statistical evaluation metrics. Instead, they can visually inspect the inner workings of their models, validating feature importance and ensuring that predictions align with domain logic.
Chronology: The Evolution of Decision Tree Visualization
The journey toward intuitive machine learning visualization has spanned several years, marked by steady open-source innovation and enterprise adoption:
- 2018 (The Inception of dtreeviz): Terence Parr originally released dtreeviz to address the glaring inadequacy of existing decision tree visualizers, which failed to show feature distributions and split spaces effectively. It quickly gained traction among data scientists.
- Continuous Community Growth: Over the subsequent years, the library evolved through active community contributions, establishing itself as the go-to utility for decision tree visualization and securing a dedicated support ecosystem on platforms like Stack Overflow.
- Deepening Ecosystem Integration: As TensorFlow expanded its suite of structured data tools via TensorFlow Decision Forests (TF-DF), the need for seamless interoperability with visualization utilities became paramount.
- Present Day (The TensorFlow Tutorial Launch): Google’s formal release of the dtreeviz Colab tutorial bridges the gap between deep learning frameworks and interpretable machine learning, signaling a major push toward explainable artificial intelligence (XAI).
Supporting Data: Practical Implementations in Real-World Datasets
To demonstrate the versatility of the library, the TensorFlow tutorial highlights applications across diverse, well-known public datasets, illustrating both classification and regression workflows.

1. Classification Modeling: The Palmer Penguins Dataset
When analyzing the classic Palmer Penguins dataset to classify species based on physical characteristics, a Random Forest classifier can be instantiated and visualized using remarkably concise Python code.
Given a trained classification model (cmodel), developers can generate a fully rendered interactive view with a few lines of code:
penguin_features = [f.name for f in cmodel.make_inspector().features()]
penguin_label = "species"  # Name of the classification target label

viz_cmodel = dtreeviz.model(
    cmodel,
    tree_index=3,  # Pick a specific tree from the forest
    X_train=train_ds_pd[penguin_features],
    y_train=train_ds_pd[penguin_label],
    feature_names=penguin_features,
    target_name=penguin_label,
    class_names=classes,
)
viz_cmodel.view()
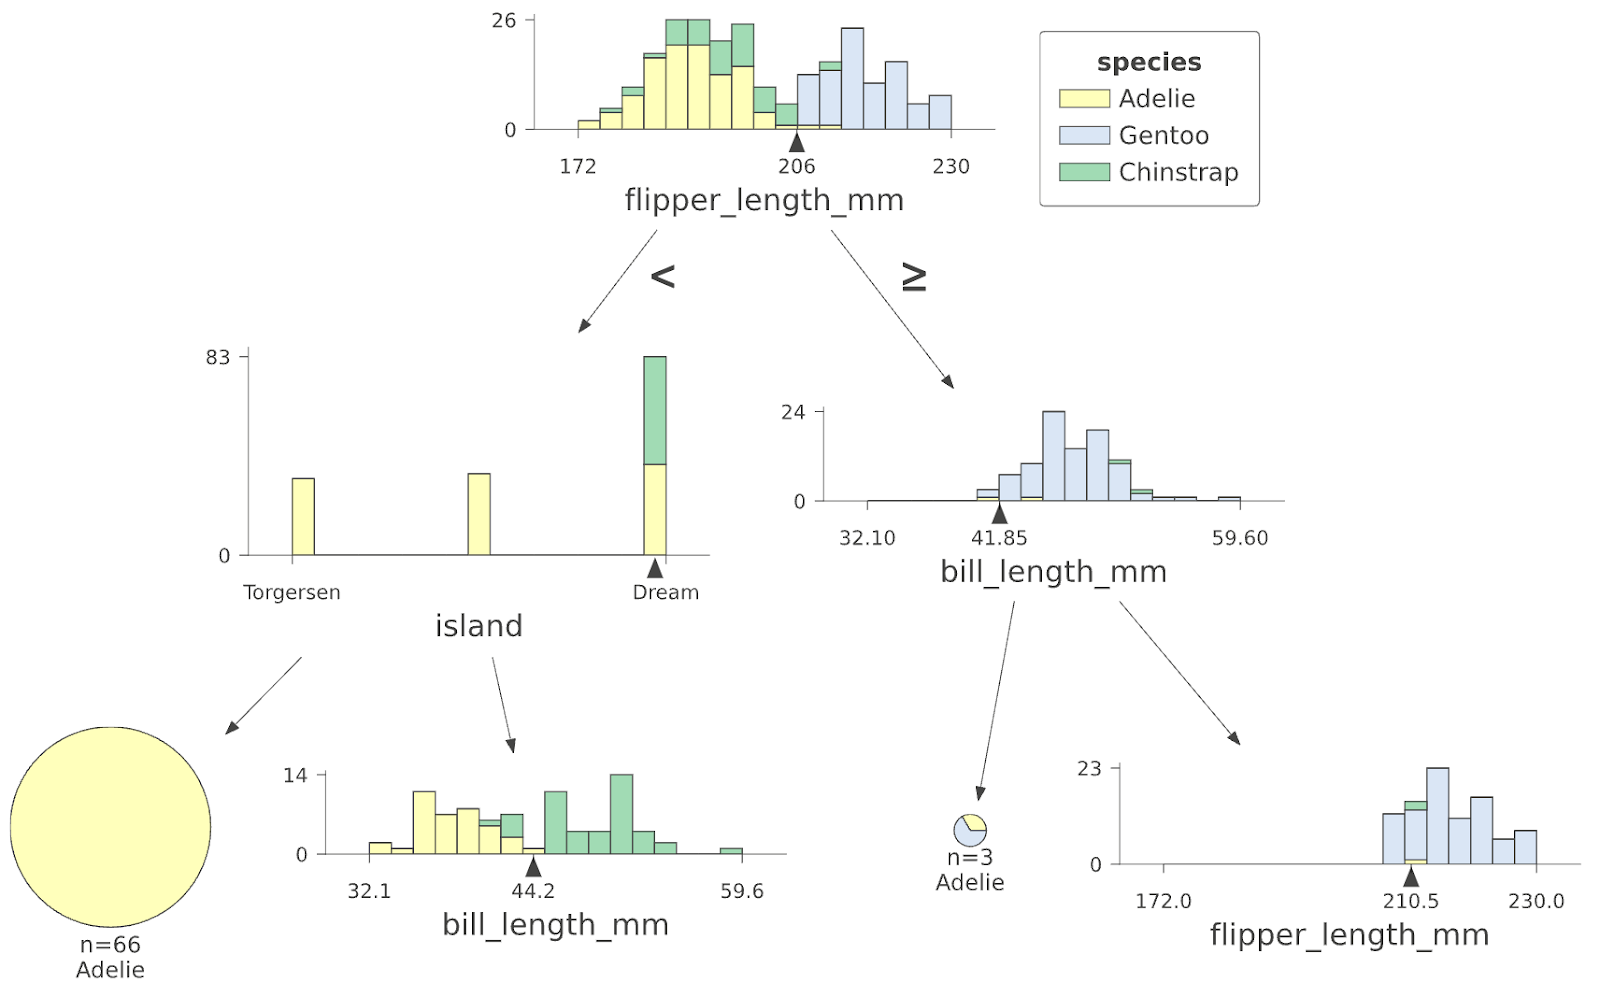
In this classification tree, the model first evaluates the flipper_length_mm feature. If the value falls below 206 millimeters, the tree branches left to evaluate geographical origin (island). If it equals or exceeds 206 millimeters, it branches right to evaluate bill length (bill_length_mm).
2. Regression Modeling: The Abalone Dataset
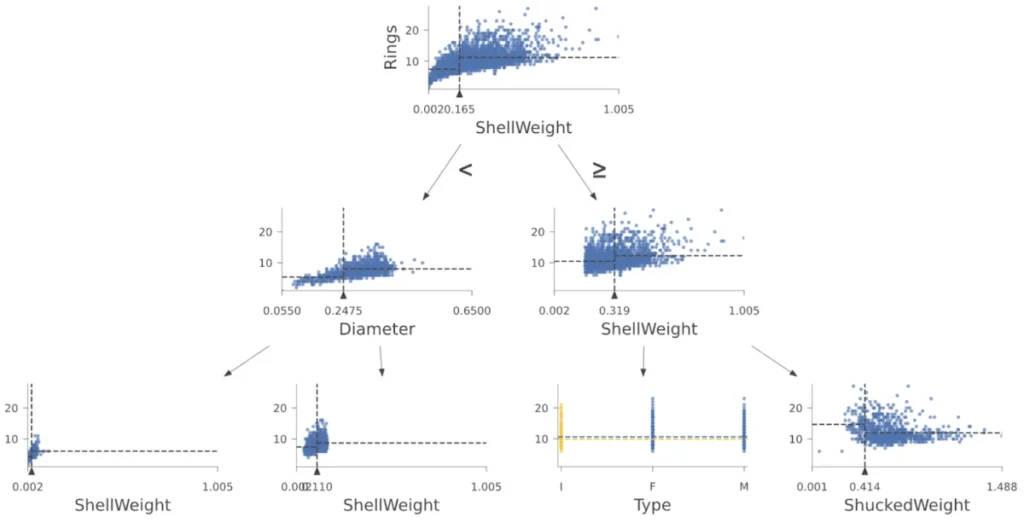
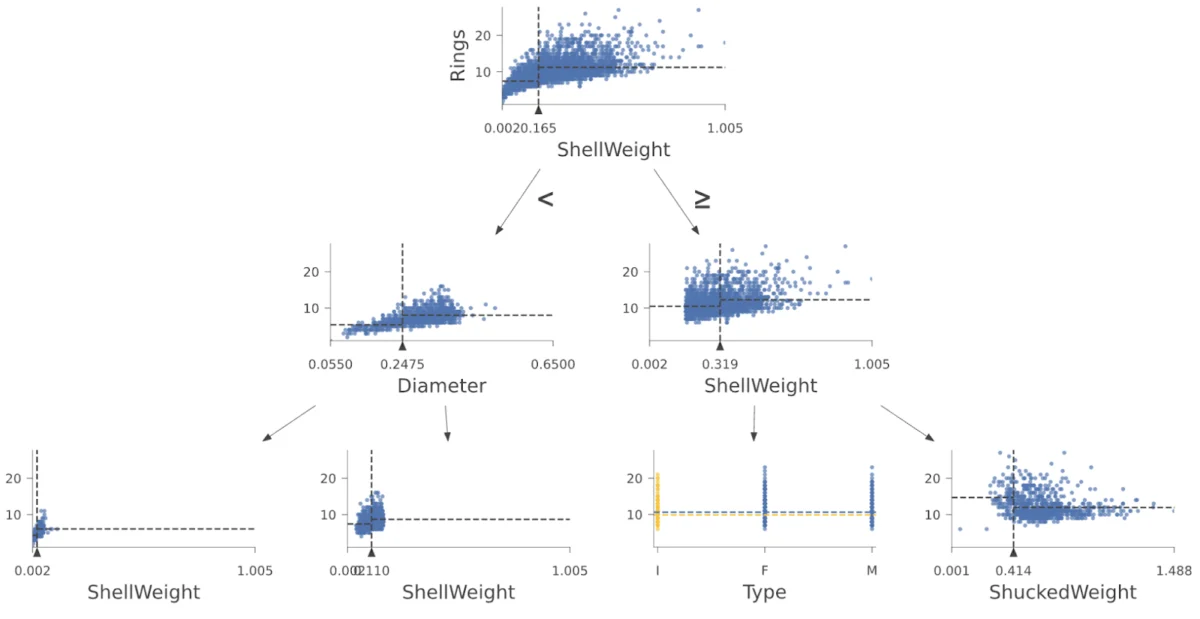
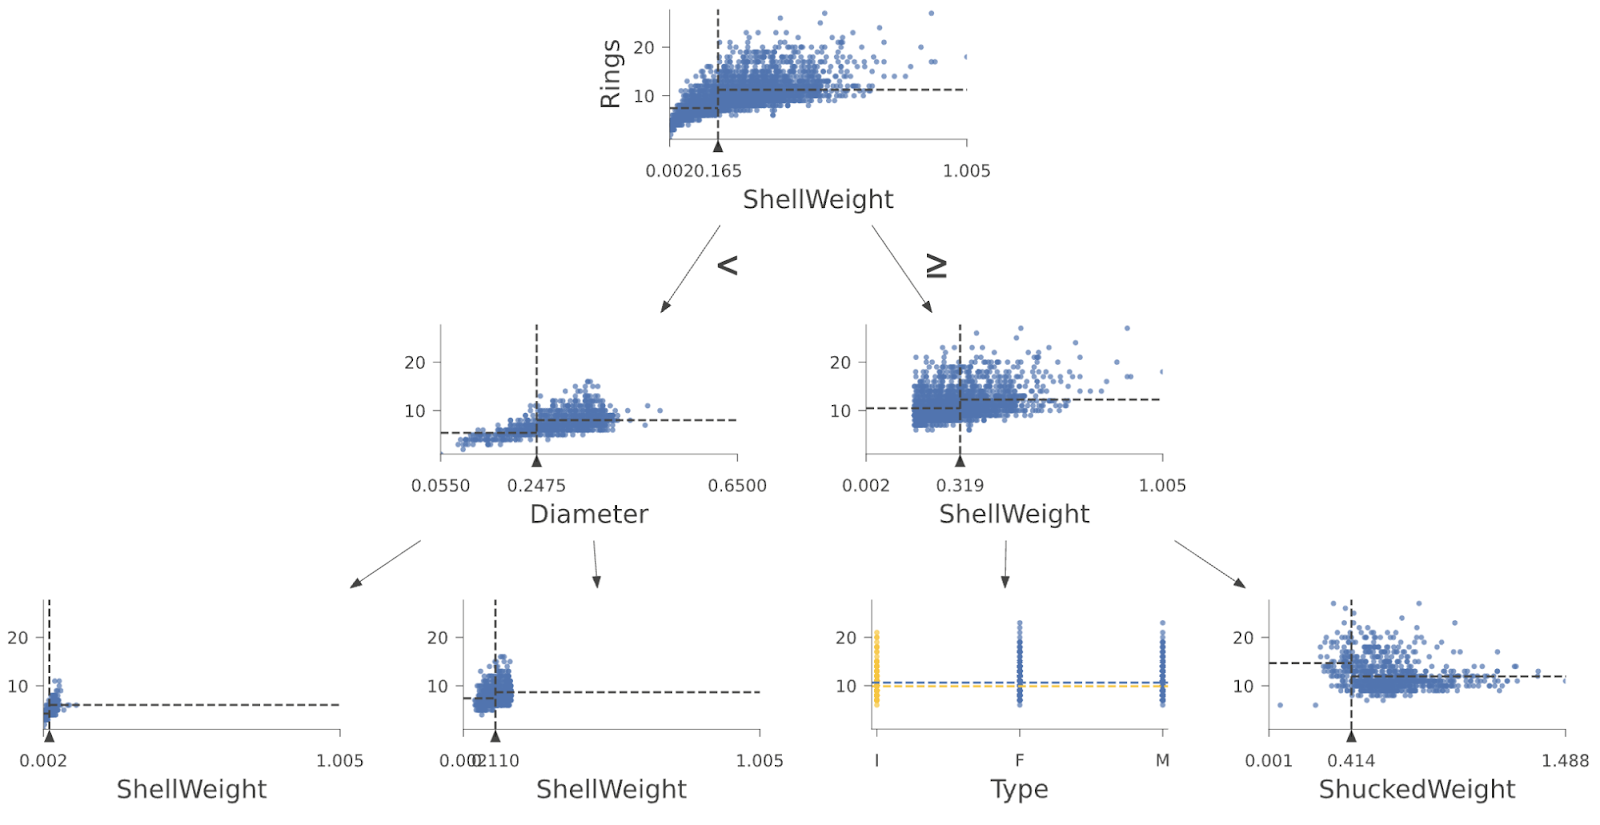
For regression tasks—such as predicting the age (measured by the number of rings) of abalones—dtreeviz provides specialized visual diagnostics. Rather than showing discrete category probabilities, the regression leaf plots display the precise distribution of target prediction values associated with instances routed to each specific leaf during training. This granular view allows engineers to spot variance, bias, and potential overfitting in continuous data estimations.
3. Tracing Individual Predictions
Beyond examining aggregate tree structures, dtreeviz empowers users to trace individual test instances (feature vectors) as they weave their way from the root node down to a terminal leaf.
By highlighting the exact decision path in vibrant orange interactive containers, the library exposes the "why" behind a prediction. For instance, if an individual is denied a line of credit or an automated insurance claim, inspecting the decision path immediately reveals the triggering thresholds—such as a debt-to-income ratio exceeding acceptable limits or a credit score falling below mandatory cutoffs.
Official Perspectives and Expert Insights
Industry experts and core contributors emphasize that model interpretability is no longer a luxury feature; it is an absolute necessity for deploying ethical, robust, and dependable AI systems.
"To learn how decision trees work and how to interpret your models, visualization is essential," notes Terence Parr, the creator of dtreeviz and engineer at Google.
As machine learning models take on increasingly high-stakes responsibilities in clinical diagnoses, financial underwriting, and legal compliance, regulatory bodies and enterprise stakeholders alike are demanding transparency. By pairing TensorFlow Decision Forests with advanced visualization tools, developers can audit model logic, root out unintended biases born from training data anomalies, and explain automated decisions directly to end-users.
Implications: The Future of Explainable AI in Tabular Data
The release of the TensorFlow dtreeviz tutorial carries profound implications for the broader machine learning community:
- Democratization of Explainability: Advanced model diagnostics are traditionally associated with complex neural network attribution methods (like SHAP or LIME). By bringing crystal-clear visualization to tree-based models—which remain the undisputed champions of tabular data tasks—Google is making model auditing accessible to a much broader audience of developers and data practitioners.
- Enhanced Trust and Accountability: In sectors heavily governed by compliance frameworks, the ability to trace a decision path down to exact numerical thresholds allows organizations to defend automated outcomes against claims of algorithmic opacity.
- Accelerated Model Debugging: Data scientists can drastically reduce the time spent troubleshooting underperforming models. By visually inspecting split points and leaf distributions, engineers can instantly identify whether a tree is splitting on noisy features or failing to capture true underlying patterns.
Next Steps for Practitioners
For developers looking to integrate these capabilities into their current machine learning pipelines, the official TensorFlow Decision Forests tutorial on dtreeviz serves as an ideal starting point. Additional design philosophies and deep-dive technical articles can be explored via Explained.ai and companion educational video resources.
As artificial intelligence continues to permeate critical pillars of society, tools that illuminate the inner workings of predictive models will undoubtedly define the standard for responsible, transparent technology development.