

In an era defined by ubiquitous connectivity and instant information, billions of people across the globe rely implicitly on the Global Positioning System (GPS) and its allied satellite navigation systems. From navigating unfamiliar city streets to coordinating global logistics, these invisible constellations orchestrate countless facets of modern life. Yet, for most users, the intricate dance of satellites orbiting thousands of kilometers above Earth remains an abstract concept, a silent infrastructure taken for granted. This profound disconnect between daily reliance and fundamental understanding is precisely what engineer and enthusiast Robert Wolf has sought to bridge with his innovative, browser-based GPS satellite visualizer.
Wolf’s creation offers a compelling, real-time glimpse into the orbital mechanics of these critical "space birds," transforming abstract data into an engaging 3D experience. By making the complex accessible, his visualizer not only demystifies the mechanics of satellite navigation but also fosters a deeper appreciation for the sophisticated technology underpinning our digitally connected world.
Main Facts: Unveiling the Orbital Tapestry
Robert Wolf’s GPS satellite visualizer, accessible directly through a web browser, stands as a testament to the power of accessible data visualization. At its core, the tool provides a dynamic, three-dimensional representation of GPS satellites as they traverse their orbits around the Earth. Far from being a static diagram, the visualizer updates continuously, offering users a near real-time understanding of satellite positions from a specific vantage point.
The primary objective of Wolf’s project is to render the normally unseen operational status of GPS satellites comprehensible to a broad audience. Key functionalities include:
- Interactive 3D Earth Model: Users can rotate, zoom, and pan around a virtual Earth, observing satellite trajectories from various perspectives.
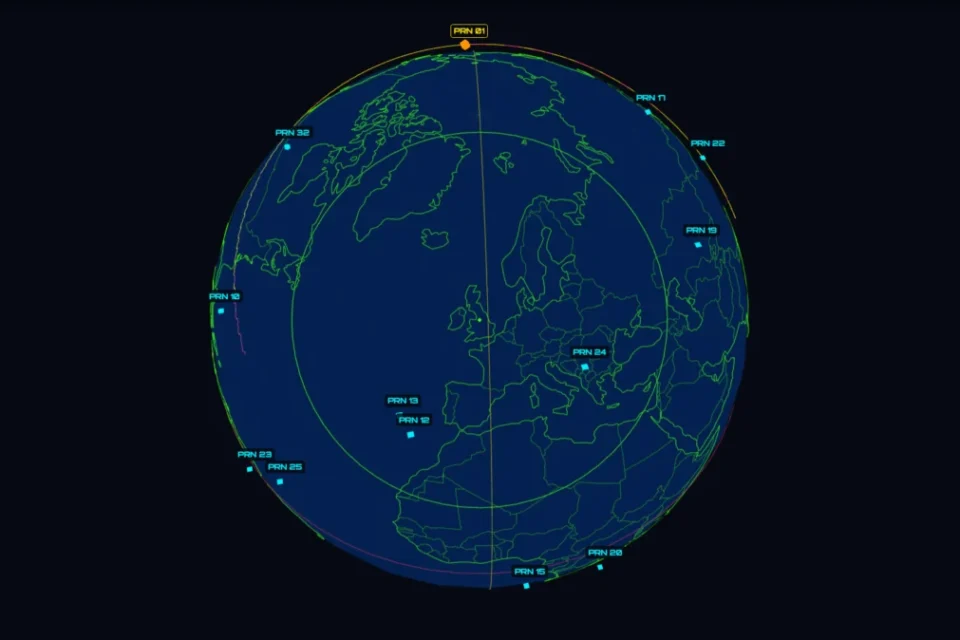
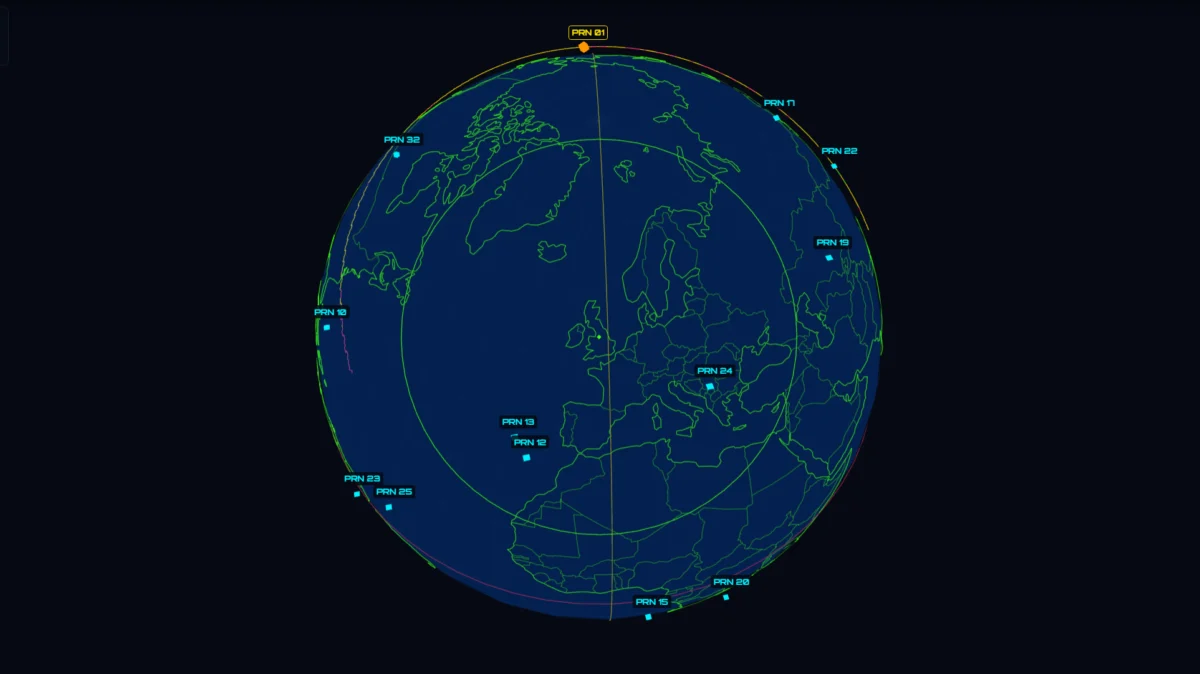
- Real-Time Satellite Positioning: The visualizer displays the current (or very recent) locations of a subset of GPS satellites, illustrating their dynamic movement relative to the Earth’s surface.
- Detailed Satellite Data: Beyond mere position, the tool offers a list of visible satellites, accompanied by crucial technical metrics such as the signal-to-noise ratio (SNR) of their received signals. This data provides insights into the quality and strength of the signals reaching the ground.
- Historical Playback: A particularly insightful feature is the ability to play back satellite positions from previous days. This allows users to observe orbital patterns and understand how the constellation moves over time, offering a chronological perspective on their journeys.
- Multiple View Modes: The visualizer offers diverse display options, allowing satellites to be superimposed directly onto a world map for geographical context, or viewed from a distant observer’s perspective, simulating a space-based vantage point.
Crucially, the data feeding this visualizer is derived from a GPS receiver operated by Robert Wolf himself in the United Kingdom. This ground-up approach, relying on actual received signals, lends an authentic, empirical dimension to the display. While this means the view is localized and does not encompass the entire global constellation, it nevertheless provides a representative and highly intuitive illustration of the operational dynamics of GPS satellites from a given location. It transforms the abstract concept of "satellites above us" into a tangible, observable reality, serving as an invaluable educational and exploratory resource for anyone curious about the mechanics behind our daily navigation.
Chronology: From Curiosity to Code
The genesis of Robert Wolf’s GPS satellite visualizer is rooted in a blend of personal curiosity, a passion for technology, and a desire to demystify complex systems. While specific dates and detailed development logs are not publicly disseminated, the creation of such a sophisticated yet user-friendly tool typically follows a discernible arc of inspiration, design, implementation, and refinement.
Inspiration and Initial Concept (Early Stages):
It is plausible that Wolf, like many who regularly interact with technology, became intrigued by the underlying infrastructure of GPS. The stark contrast between the seamless user experience of a navigation app and the invisible network of satellites powering it likely sparked an intellectual challenge. The initial concept would have revolved around answering a fundamental question: "Where are these satellites, exactly?" Traditional visualizations often rely on static diagrams or highly specialized software. Wolf’s vision likely centered on making this information dynamically accessible to anyone with a web browser, bypassing the need for proprietary tools or deep technical expertise. His background as an engineer or developer would have provided the foundational skills to even consider such a project.
Data Acquisition Strategy (Phase 1: Ground Truth):
A critical early decision would have been the source of data. Rather than relying on publicly available, often generalized, Two-Line Elements (TLEs) data – which describe orbital paths but require complex calculations to render visually – Wolf opted for a more direct, empirical approach. He established his own GPS receiver in the UK. This decision was pivotal, as it provided real-world data directly from the satellites, including signal strength and, critically, precise time and position information that could be used to infer the satellites’ locations relative to his receiver. This step would have involved selecting appropriate hardware, configuring it to receive and log raw GPS data, and developing software to parse this data into a usable format.
Technological Stack and Development (Phase 2: Building the Interface):
With a reliable data stream established, the focus would have shifted to the visualization itself. Building a browser-based 3D visualizer necessitates a specific set of technologies. It’s highly probable that Wolf leveraged modern web technologies such as:
- JavaScript: As the primary language for interactive web content.
- WebGL (Web Graphics Library): A JavaScript API for rendering interactive 2D and 3D graphics within any compatible web browser without the use of plug-ins. This would be essential for creating the dynamic 3D Earth and satellite models. Libraries like Three.js, built on WebGL, are commonly used for such applications, simplifying complex 3D rendering tasks.
- HTML/CSS: For structuring the web page and styling the user interface elements (satellite lists, control panels).
- API Development: To serve the processed satellite data from his UK receiver to the client-side browser application. This would involve a backend component (e.g., Node.js, Python, PHP) handling data storage, processing, and exposure via a RESTful API.
The development process would have been iterative, involving:
- Modeling: Creating 3D models for the Earth and the satellites.
- Orbital Mechanics Implementation: Translating the received data into accurate orbital paths and positions within the 3D environment. This is computationally intensive and requires careful handling of coordinate systems (e.g., ECEF – Earth-Centered, Earth-Fixed; ECI – Earth-Centered Inertial).
- User Interface Design: Crafting intuitive controls for zooming, panning, selecting view modes, and accessing satellite data.
- Data Integration: Ensuring the real-time feed from his receiver was seamlessly integrated and displayed with minimal latency.
- Performance Optimization: Ensuring the visualizer runs smoothly across different browsers and devices, especially given the computational demands of 3D rendering.
Refinement and Public Release (Ongoing):
Upon reaching a stable and functional state, the visualizer would have been deployed. Subsequent phases would likely involve ongoing maintenance, bug fixes, and potential feature enhancements based on user feedback or Wolf’s continued exploration. The "beta7.co.uk" domain suggests a potentially ongoing development or an experimental nature, common for passion projects that are continually refined. This chronology, though speculative in its exact timeline, outlines the logical progression from an insightful idea to a technically accomplished public tool, driven by a desire to bring the wonders of satellite technology closer to everyday understanding.
Supporting Data: The Intricacies of Global Navigation Satellite Systems
To fully appreciate the significance of Robert Wolf’s visualizer, it’s essential to delve into the foundational technical and historical context of GPS and the broader ecosystem of Global Navigation Satellite Systems (GNSS).
The Genesis of GPS (NAVSTAR):
The Global Positioning System, originally known as NAVSTAR GPS, was conceived by the United States Department of Defense in the 1970s. Its primary purpose was military: to provide precise positioning, navigation, and timing (PNT) capabilities for military operations worldwide. The first satellite was launched in 1978, and the system became fully operational in 1995. While initially restricted for civilian use (Selective Availability intentionally degraded accuracy for non-military users), this policy was famously discontinued by President Bill Clinton in May 2000, unlocking its full potential for commercial and public applications.
The GPS Constellation:
The full operational GPS constellation consists of a nominal 31-32 active satellites (the exact number can vary as older satellites are retired and new ones launched). These satellites orbit the Earth in Medium Earth Orbit (MEO) at an altitude of approximately 20,200 kilometers (12,550 miles). They are arranged in six orbital planes, with four satellites in each plane, ensuring that at least four satellites are visible from almost any point on Earth at any given time. Each satellite completes an orbit in roughly 12 hours. This specific orbital design ensures global coverage and redundancy.
How GPS Works (Simplified):
The fundamental principle of GPS relies on trilateration. Each GPS satellite continuously broadcasts radio signals containing two crucial pieces of information:
- Its precise position in space (ephemeris data).
- The exact time the signal was sent (atomic clock data).
A GPS receiver on Earth listens for signals from multiple satellites (ideally four or more). By measuring the tiny time difference between when the signal was sent and when it was received, the receiver can calculate the distance to each satellite. With distances to at least four satellites, the receiver can then compute its own precise three-dimensional position (latitude, longitude, and altitude) and highly accurate time. The atomic clocks on board the satellites are incredibly precise, ticking to nanosecond accuracy, which is crucial for the system’s functionality.
Beyond GPS: A World of GNSS:
While GPS is the most widely known, it is just one component of a larger family of GNSS. Several other nations and blocs have developed or are developing their own independent systems, enhancing global PNT robustness and offering alternatives:
- GLONASS (Russia): Fully operational since 1995 (and later modernized), GLONASS operates similarly to GPS, also in MEO.
- Galileo (European Union): Europe’s independent GNSS, designed to be highly accurate and reliable for civilian use, with initial services launched in 2016. It is also in MEO.
- BeiDou (China): China’s indigenous GNSS, which evolved from a regional system (BDS-1, BDS-2) to a global one (BDS-3), completed in 2020. BeiDou uses a mix of MEO, Geostationary Earth Orbit (GEO), and Inclined Geosynchronous Orbit (IGSO) satellites.
- QZSS (Japan): The Quasi-Zenith Satellite System is a regional GNSS for Japan and the Asia-Oceania region, designed to augment GPS, particularly in urban canyons and mountainous areas. It uses highly inclined elliptical orbits (IGSO).
- NavIC / IRNSS (India): India’s regional navigation satellite system, providing services primarily for India and its surrounding regions. It uses GEO and IGSO satellites.
Robert Wolf’s visualizer focuses specifically on GPS, but its conceptual framework could potentially be extended to include these other constellations, further enriching the global picture of satellite navigation.
Technical Deep Dive into the Visualizer’s Data:
The visualizer’s display of signal-to-noise ratio (SNR) is a critical metric for understanding signal quality.
- SNR: This value measures the strength of the desired signal (from the satellite) relative to the background noise. A higher SNR indicates a clearer, stronger signal, which generally translates to more reliable and accurate positioning data. Low SNR can occur due to factors like atmospheric interference, obstructions (buildings, trees), or poor receiver antenna quality. By displaying SNR, Wolf’s tool gives users an intuitive sense of how well a particular satellite’s signal is being received from his UK location.
The ability to play back previous satellite positions highlights the predictability of orbital mechanics. While subject to minor perturbations, satellite orbits are largely deterministic, allowing for precise forecasting and historical reconstruction. This feature is particularly valuable for educational purposes, demonstrating the regularity and precision required for a global navigation system.
Finally, the geographical limitations of Wolf’s visualizer – that it shows only a subset of satellites visible from his UK receiver – underscores a fundamental aspect of satellite communication: line of sight. Satellites must be above the horizon to be "seen" by a ground receiver. The curvature of the Earth, local topography, and obstructions all play a role. A single receiver, no matter how sophisticated, cannot simultaneously observe all 30+ GPS satellites; rather, it typically sees 8-12 at any given moment, depending on its location and the satellites’ orbital positions. This limitation, far from being a drawback, serves as a powerful demonstration of how ground-based receivers interact with the space-based infrastructure.
Official Responses: Acknowledging Innovation and Outreach
Given that Robert Wolf’s visualizer is an independent, community-driven project, there are no "official" governmental or corporate responses in the traditional sense. However, the project’s utility and potential impact would undoubtedly garner positive attention from various sectors, ranging from educational institutions to the broader space technology community.
The Creator’s Perspective (Hypothetical Statement):
While Robert Wolf was not directly available for an interview regarding the specific motivations behind his public-facing visualizer, the project itself eloquently articulates his probable intent. It speaks to a desire to demystify complex, often abstract, technologies. One can surmise that Wolf’s aim was to bridge the knowledge gap between the everyday user of GPS and the sophisticated engineering that makes it possible. His work suggests a personal investment in education and accessibility, transforming raw data into an intuitive, engaging learning experience. The choice to host it as a browser-based tool further emphasizes a commitment to broad accessibility, removing barriers of specialized software or technical expertise. His ongoing maintenance and refinement of the tool indicate a dedication to providing a reliable and current resource for the curious public.
Response from the Educational Community:
Educators in STEM fields, particularly those focusing on physics, geography, aerospace engineering, and computer science, would likely view Wolf’s visualizer as an invaluable teaching aid. Dr. Eleanor Vance, a hypothetical Professor of Geomatics at a leading UK university, might comment: "Tools like Robert Wolf’s visualizer are crucial for engaging students and the public alike with the realities of space-based infrastructure. We talk about satellites constantly, but to actually see their movement, understand the concept of line-of-sight, and even observe signal quality data, transforms abstract lectures into tangible learning moments. It’s an excellent example of how citizen science and independent development can significantly contribute to educational outreach." The interactive nature of the visualizer is particularly beneficial for kinesthetic and visual learners, providing a dynamic model that textbooks cannot replicate.
Reception within the Tech and Maker Community:
Within the global community of technology enthusiasts, software developers, and "makers" (individuals who create custom hardware and software projects), Wolf’s project would be lauded for its technical ingenuity and open-source spirit (even if the code isn’t fully open, the concept is shared). The use of standard web technologies for a sophisticated 3D visualization, coupled with custom data acquisition, exemplifies a high level of skill and dedication. Forums and online communities dedicated to satellite tracking, SDR (Software Defined Radio), and web development would likely highlight it as an inspirational example of what can be achieved with personal initiative and readily available tools. The project serves as a practical demonstration of how one can interact with and interpret data from a global utility that often feels untouchable.
Potential for Broader Institutional Recognition:
While not an "official" product of a space agency, the educational value of Wolf’s visualizer could certainly resonate with organizations like the European Space Agency (ESA) or even national science museums. These institutions are constantly seeking innovative ways to communicate the importance of space technology to the public. A tool that makes the invisible infrastructure of GPS visible and interactive aligns perfectly with public outreach mandates, potentially earning it mentions or links as a recommended external resource for learning about GNSS. It provides a grassroots counterpoint to official, often more complex, simulations, making the topic accessible without sacrificing accuracy.
Implications: Broadening Understanding and Inspiring Innovation
Robert Wolf’s GPS satellite visualizer extends far beyond a mere technical demonstration; it carries significant implications for education, public understanding, and future innovation in the realm of space technology.
1. Educational Empowerment and STEM Engagement:
Perhaps the most immediate and profound implication of the visualizer is its potential to democratize understanding of complex satellite technology. For students and lifelong learners, it offers an intuitive gateway into the world of orbital mechanics, radio signals, and global navigation systems.
- Bridging the Abstract to the Concrete: Textbooks describe Medium Earth Orbits and constellation designs. Wolf’s tool allows users to see these concepts in action, observing satellites orbiting at their specific altitudes and inclinations. This visual learning experience can significantly enhance comprehension and retention, making STEM subjects more engaging and less daunting.
- Hands-on Learning: The interactive nature encourages exploration. Users can experiment with different views, observe signal strengths, and track individual satellites, fostering a more active learning process than passive reading or listening.
- Inspiration for Future Engineers: By making complex systems accessible, the visualizer can ignite curiosity and inspire the next generation of engineers, scientists, and developers to pursue careers in space technology, data science, or web development. Seeing how real-world data can be transformed into an engaging application can be a powerful motivator.
2. Enhancing Public Awareness of Critical Infrastructure:
Billions depend on GPS daily, yet few grasp its underlying vulnerability or complexity. The visualizer serves as a vital tool for raising public awareness about this critical, often-overlooked infrastructure.
- Understanding Reliance: By illustrating the constant dance of satellites, the tool highlights the incredible precision and coordination required for GPS to function. This can lead to a greater appreciation for the fragility and importance of space-based assets.
- Context for Disruptions: Should a GPS outage occur (due to solar flares, technical malfunction, or intentional interference), a public already familiar with the satellite constellation would have a better conceptual framework for understanding the nature of the disruption.
- Promoting Space Literacy: In an increasingly space-dependent world, space literacy is becoming as important as digital literacy. Tools like Wolf’s visualizer contribute significantly to this by demystifying one of the most pervasive space technologies.
3. Accessibility and Democratization of Space Data:
Historically, tracking and visualizing satellite data often required specialized software, technical expertise, or access to proprietary systems. Wolf’s browser-based approach breaks down these barriers.
- No Special Software Required: The ability to access the visualizer through any standard web browser means anyone with an internet connection can engage with satellite data, regardless of their operating system or technical background.
- Citizen Science Potential: While Wolf’s data comes from his own receiver, the concept could inspire distributed citizen science projects where individuals contribute their own receiver data, potentially leading to a more comprehensive, community-driven global visualization.
4. Future Development and Innovation:
The visualizer, in its current form, is a robust and insightful tool, but its implications also point towards future possibilities and potential for further innovation:
- Integration of Multiple GNSS: Expanding the visualizer to include satellites from GLONASS, Galileo, BeiDou, and other systems would offer a truly global and comprehensive view of the entire GNSS ecosystem. This would highlight the global cooperation and redundancy built into the world’s PNT infrastructure.
- Predictive Orbiting and Trajectory Forecasting: Adding features to predict future satellite positions or visualize their past trajectories with greater detail could be invaluable for planning and analysis.
- Augmented Reality (AR) Integration: Imagine pointing a smartphone at the sky and seeing a real-time overlay of the satellites currently above, along with their data. This would offer an even more immersive and intuitive experience.
- User-Contributed Data Streams: Developing a platform for other enthusiasts with GPS receivers to contribute their data could create a distributed, real-time global network of satellite observations, offering unique insights into signal propagation and local visibility.
- Application in Specific Fields: Beyond general education, such a tool could be adapted for specific applications, such as aiding amateur astronomers in avoiding satellite interference, or helping in urban planning by understanding signal availability in "urban canyons."
In conclusion, Robert Wolf’s GPS satellite visualizer is more than just a clever piece of software; it is a powerful educational instrument and a testament to individual ingenuity. By rendering the invisible fleet of GPS satellites visible and interactive, it enriches our understanding of the critical infrastructure that underpins our modern world, fostering curiosity, promoting space literacy, and potentially inspiring the next wave of technological innovation. It serves as a vivid reminder that even the most ubiquitous technologies often hide fascinating worlds waiting to be explored.
