

The Arduino Serial Plotter is a cornerstone tool for hobbyists, engineers, and students alike. Since its introduction, it has provided a seamless way to visualize sensor data, debug signal noise, and analyze real-time waveforms without the overhead of external data-logging software. However, as the Arduino IDE has evolved into its second major iteration (IDE 2.x), users have encountered a persistent hurdle: the lack of native, user-friendly controls for adjusting the X and Y axis scales.
For many, the default behavior of the Serial Plotter—which defaults to a rolling 50-point window—is insufficient for long-duration analysis or stable signal monitoring. While the community has often turned to Python-based libraries like Matplotlib or specialized software like Processing to bypass these limitations, a more direct solution exists. By manipulating the IDE’s underlying configuration files, users can regain control over their visualization environment.
The Core Challenge: Why Scale Matters
In the modern Arduino IDE 2.x, the Serial Plotter operates on an "auto-scaling" logic. The Y-axis dynamically expands and contracts to fit the minimum and maximum values of the most recent 50 data points. While this is helpful for rapid, fluctuating data, it creates "jitter" in stable signals, such as sine waves or steady voltage readings.
Furthermore, the X-axis is fixed at a 50-point buffer. If your signal frequency is high or your sampling rate is aggressive, the graph scrolls too rapidly to perform meaningful visual analysis. When attempting to observe a signal over a longer timeframe, the current interface often leaves developers feeling blinded by the brevity of the display window.
The Experimental Proof
To visualize this limitation, consider the following standard Arduino loop:
float t; float y;
void setup()  Serial.begin(115200);

void loop()
  t = micros() / 1.0e6;
  y = sin(2 * PI * t);
  Serial.println(y);
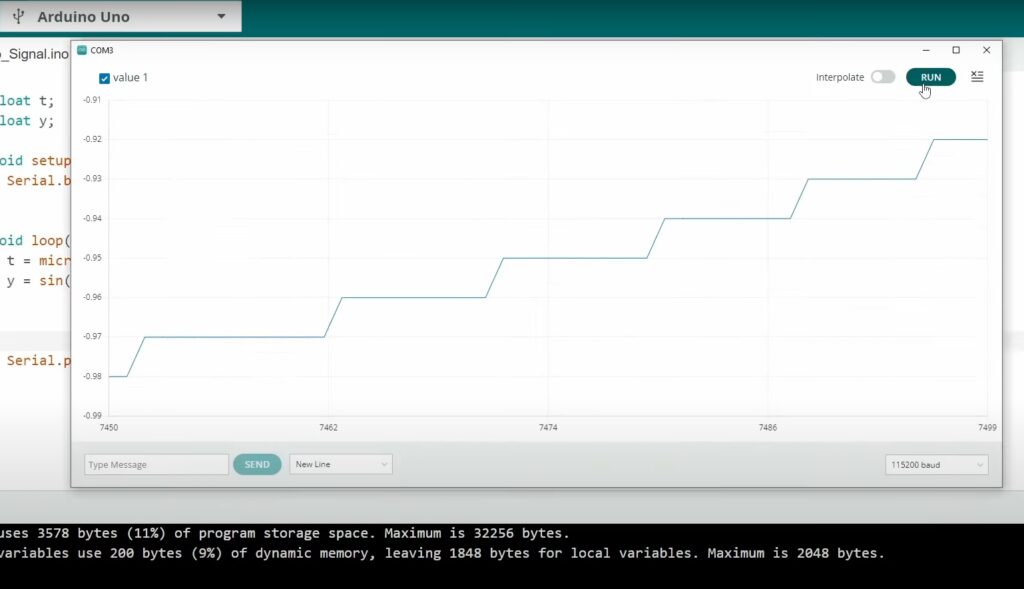
When running this code, you will observe the Y-axis constantly hunting for the signal peaks. If the signal is stable, the lack of a static reference frame makes it difficult to detect subtle drifts or anomalies.
Step-by-Step: Stabilizing the Y-Axis
The Y-axis challenge is the easiest to address because it can be solved at the firmware level without touching the IDE’s source files. By "tricking" the plotter into recognizing a specific range, you can force the Y-axis to stay fixed.
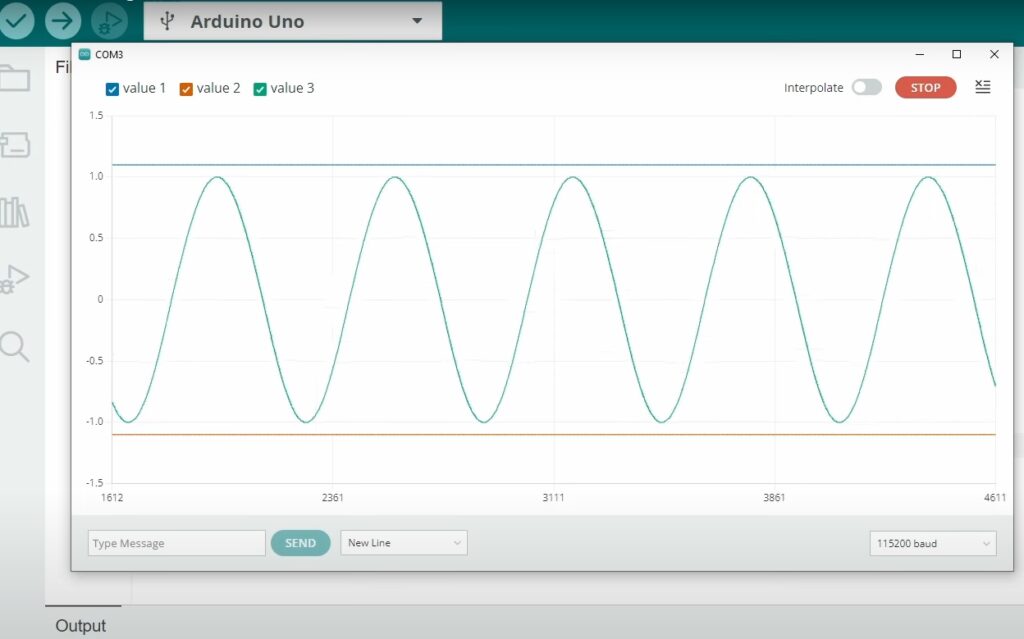
The "Ghost Signal" Technique
By sending dummy values that represent your desired floor and ceiling, the plotter will automatically scale to include those values, effectively pinning the Y-axis in place.
Modified Code Example:
float t; float y;
void setup() Serial.begin(115200);
void loop()
t = micros() / 1.0e6;
y = sin(2 * PI * t);
// Send "Ghost" values to anchor the Y-axis scale
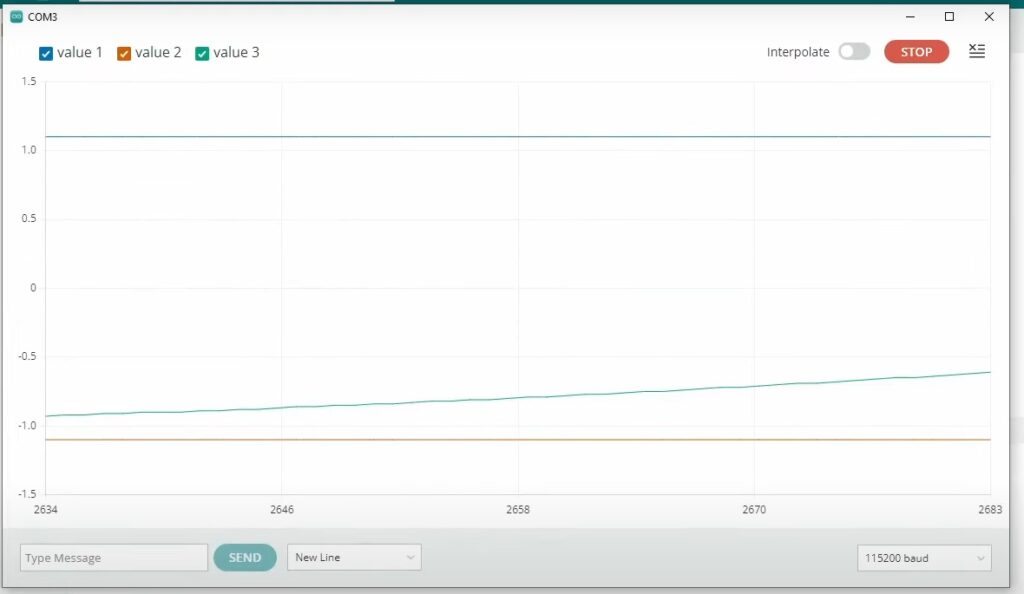
Serial.print("1.1, ");
Serial.print("-1.1, ");
Serial.println(y);
By adding 1.1 and -1.1 to every serial print, you provide the plotter with a constant range that exceeds the peak-to-peak amplitude of the sine wave. The plotter will now lock the vertical scale, resulting in a perfectly stable, non-jumping visualization.
Advanced Customization: Extending the X-Axis
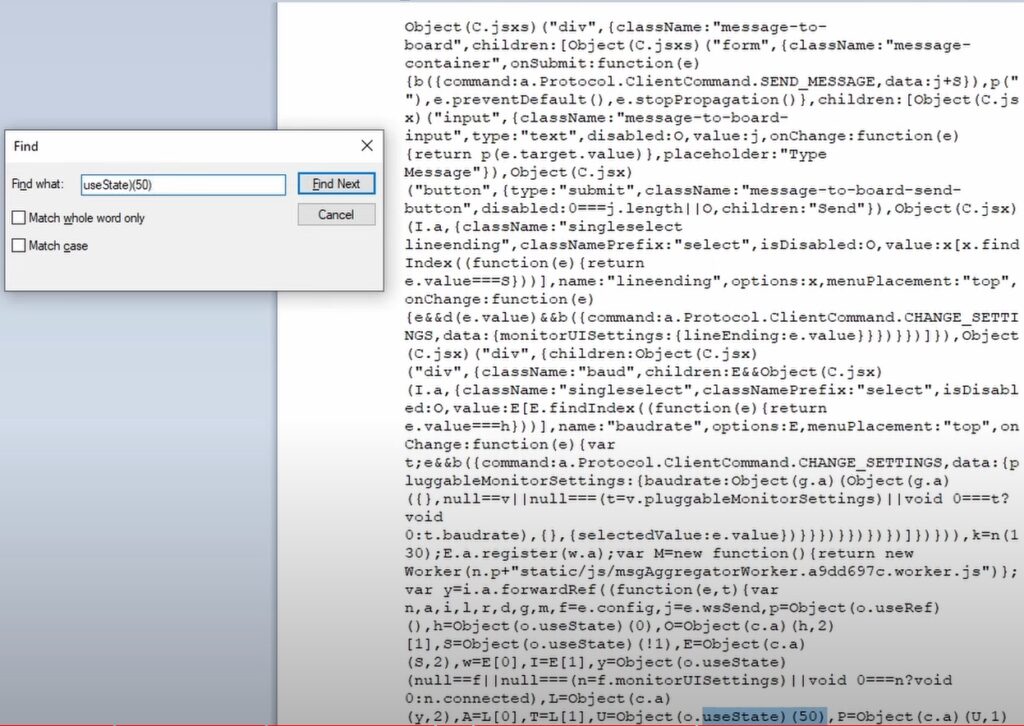
While the Y-axis is easily tamed, the X-axis is hard-coded into the Arduino IDE’s JavaScript-based frontend. Modifying this requires navigating the installation directory and altering a chunked script.
A Note on Caution
Before proceeding, ensure that you have backed up your original files. Modifying IDE core files can lead to instability if done incorrectly.
Locating the Configuration File
The file responsible for the plotter’s behavior is typically found within the resources folder of your Arduino IDE installation.
- Windows: Navigate to
C:Users<YourUser>AppDataLocalArduino15packagesbuiltintoolsarduino-ide...resourcesapplib. - Mac/Linux: Navigate to the
Contents/Resources/app/libdirectory within your application package.
Look for a file named main.35ae02cb.chunk.js (note: the hex string in the filename may vary slightly depending on your specific IDE version).
Editing the Script
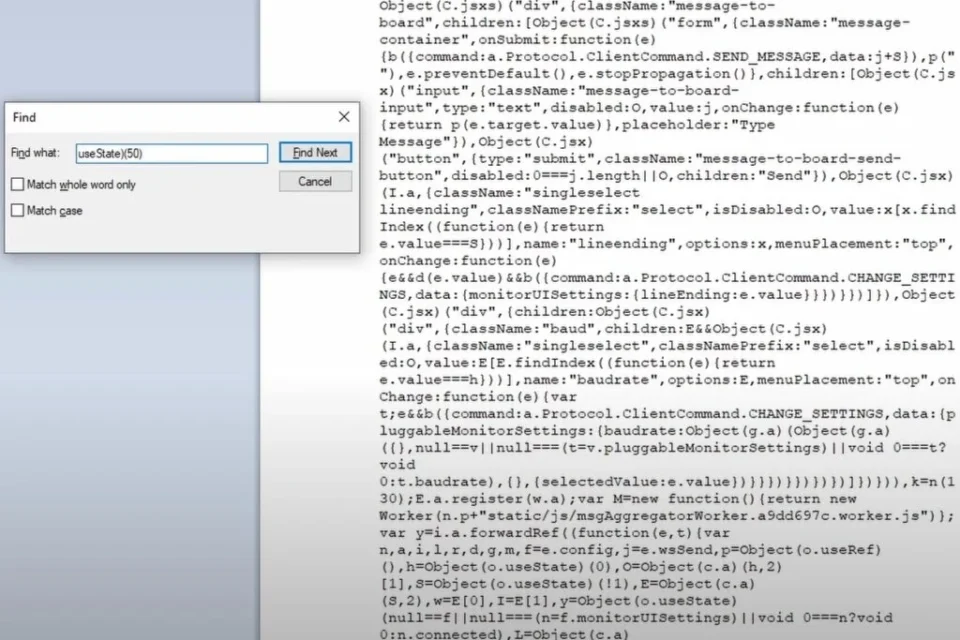
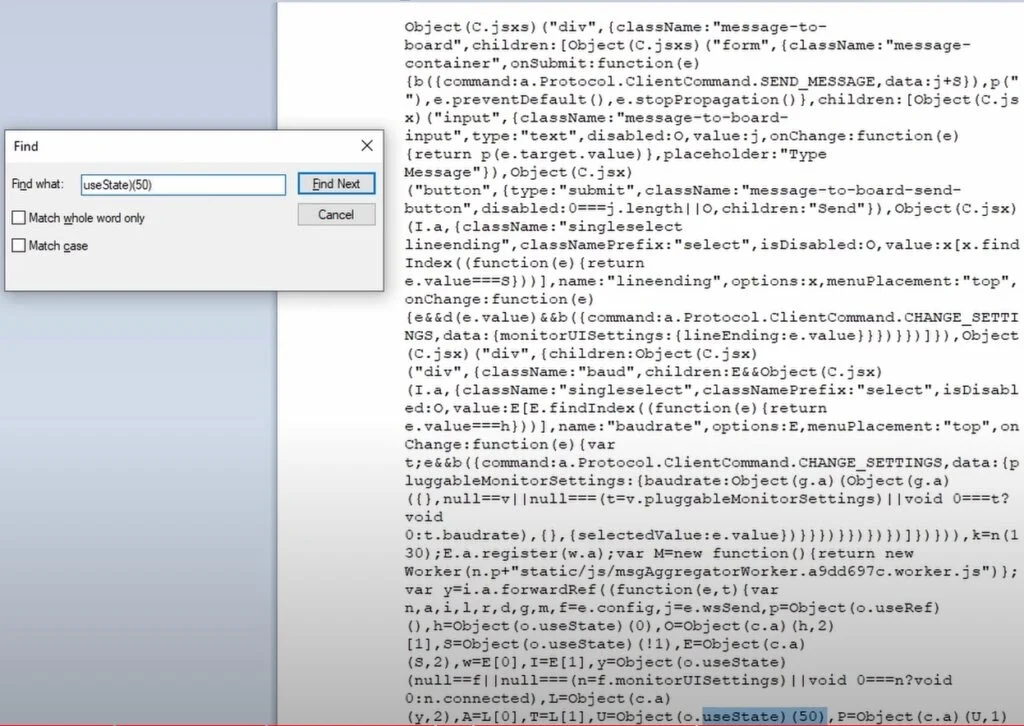
- Open the file in a code editor like VS Code or Notepad++.
- Use the search function (Ctrl+F) to look for the numeric value
50. - You are looking for a variable associated with the "max points" or "history length."
- Change the value from
50to your desired buffer size—for instance,500or1000. - Save the file and restart the Arduino IDE.
Once restarted, the Serial Plotter will attempt to buffer the new number of data points before beginning the scroll process, providing a significantly wider window for analysis.
Implications of Modifying IDE Core Files
While increasing the X-axis limit provides immediate benefits for data analysis, users must remain aware of the hardware limitations of their development environment.
Data Overload and Memory
The Arduino Serial Plotter is rendered using the browser-based infrastructure of the IDE. When you force the plotter to track 5,000 points instead of 50, you are significantly increasing the memory overhead of the visualization engine. If your baud rate is set high (e.g., 115200 or higher) and you are sending large amounts of data, the Serial Plotter may experience "hiccups."
Testing has shown that when the buffer exceeds 3,000 to 4,000 points, the plotter may experience dropped frames or, in extreme cases, a complete hang. This is not necessarily a failure of the Arduino hardware, but rather a limitation of the Serial Plotter’s ability to re-render the SVG/Canvas elements quickly enough to keep up with the incoming stream.
Long-Term Maintenance
Every time you perform an official update to the Arduino IDE, these configuration files will likely be overwritten and reset to their default values. It is highly recommended to keep a text document of your customized settings so you can quickly re-apply them after an IDE update.
Supporting Data: When to Use External Tools
While the "hack" described above is excellent for quick, on-the-fly debugging, it is not a replacement for professional data acquisition. If your project requires any of the following, you should consider transitioning to dedicated software:
- High-Frequency Analysis: If you are sampling at frequencies higher than 1kHz, the Serial Plotter will struggle with timing accuracy.
- Data Logging: If you need to save the data to a CSV or Excel file for later analysis, the native Serial Plotter is insufficient.
- Multi-Variate Analysis: If you are monitoring 10+ variables simultaneously, the overlapping lines in the Serial Plotter become unreadable.
In these cases, Python’s pyserial library combined with matplotlib or pyqtgraph offers a much more robust, albeit complex, solution. These tools allow for custom axis labeling, zooming, and persistent data logging.
Conclusion
The Arduino Serial Plotter remains one of the most accessible tools for embedded systems development. While it lacks some of the advanced features found in professional oscilloscopes or data acquisition software, its functionality can be significantly extended through creative coding and minor configuration tweaks.
By using "Ghost Signals" to lock the Y-axis and modifying the main.35ae02cb.chunk.js file to expand the X-axis buffer, you can transform the Serial Plotter into a much more powerful diagnostic tool. As with all modifications to development tools, proceed with caution and keep backups of your environment. Whether you are debugging a simple sensor reading or fine-tuning a PID control loop, these adjustments will undoubtedly provide the clarity needed to iterate faster and more efficiently.
As the Arduino ecosystem continues to grow, it is hoped that the developers will eventually introduce a GUI-based settings menu for the Serial Plotter, removing the need for these manual workarounds. Until then, these techniques remain the gold standard for power users looking to get the most out of their Arduino IDE.
