Mastering Your Hardware: A Deep Dive into Customizing the KDE Plasma System Monitor
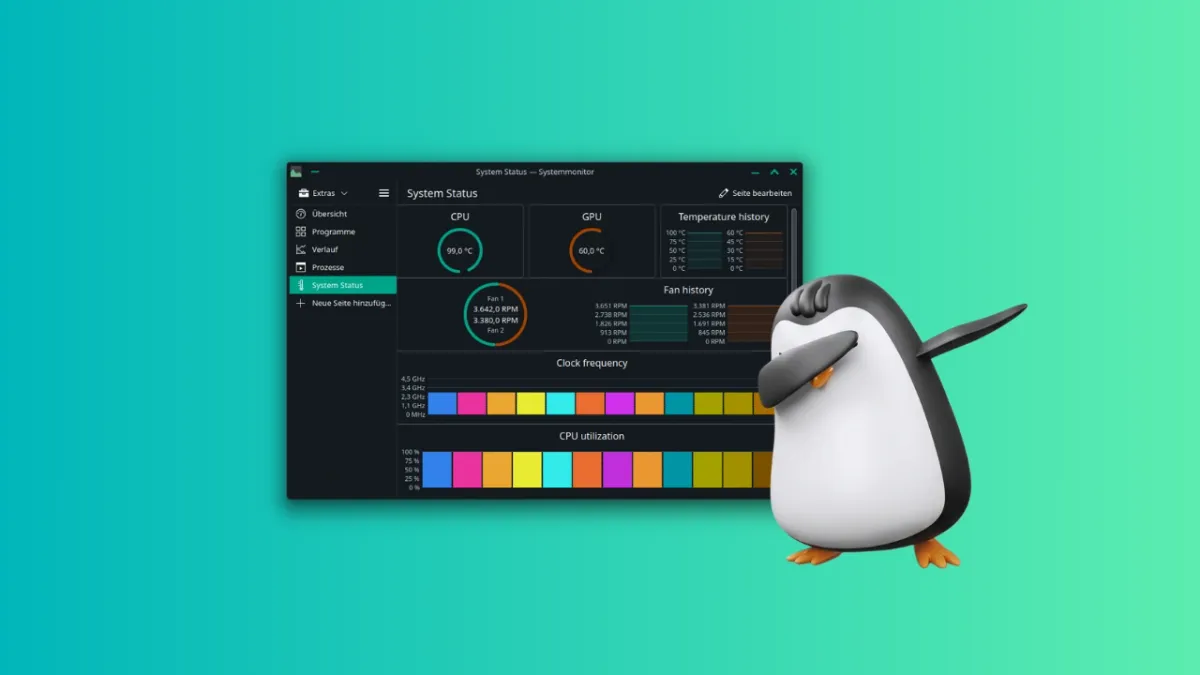
One of the defining characteristics of the KDE Plasma desktop environment has always been its unwavering commitment to user agency. While many modern operating systems move toward a "walled garden" approach, hiding complexity behind simplified, rigid interfaces, KDE remains a bastion of modularity. Nowhere is this more apparent than in the KDE Plasma System Monitor—a tool that, despite its utilitarian name, functions more like a professional-grade dashboard design suite than a simple task manager.
For users who want to move beyond the default views, the System Monitor offers a robust, canvas-like experience. In this comprehensive guide, we will explore how to transform this utility from a basic resource tracker into a high-performance, personalized monitoring hub tailored specifically to your hardware and workflow.
The Architecture of Information: Understanding the System Monitor Layout
Before diving into the aesthetics, it is essential to understand the underlying framework of the KDE System Monitor. The application does not simply list processes; it utilizes a hierarchical layout engine that governs how data sensors are rendered on your screen.
The Hierarchical Structure
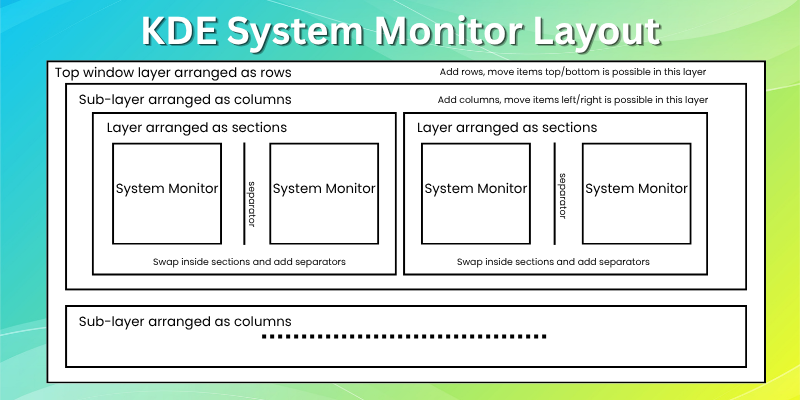
The system is built on a "Layered Grid" model:

- The Window Layer: The top-level container, acting as the primary canvas for your dashboard.
- The Row Layer: Horizontal groupings that span the width of the application.
- The Column Layer: Vertical divisions within a row, allowing for side-by-side data comparison.
- The Section Layer: The final containers that house individual, functional widgets.
When you enter "Edit Mode," the application exposes these boundaries. Clicking on a specific element reveals only the configuration options relevant to that layer. For example, selecting a column allows you to adjust width proportions, while selecting a section allows you to drag-and-drop or swap the specific sensor widgets contained within. Understanding this "nesting" is the secret to building a complex, professional-looking interface without encountering the frustration of misaligned or overlapping elements.
Step-by-Step: Constructing a Custom Monitoring Dashboard
Phase 1: Initializing Your Workspace
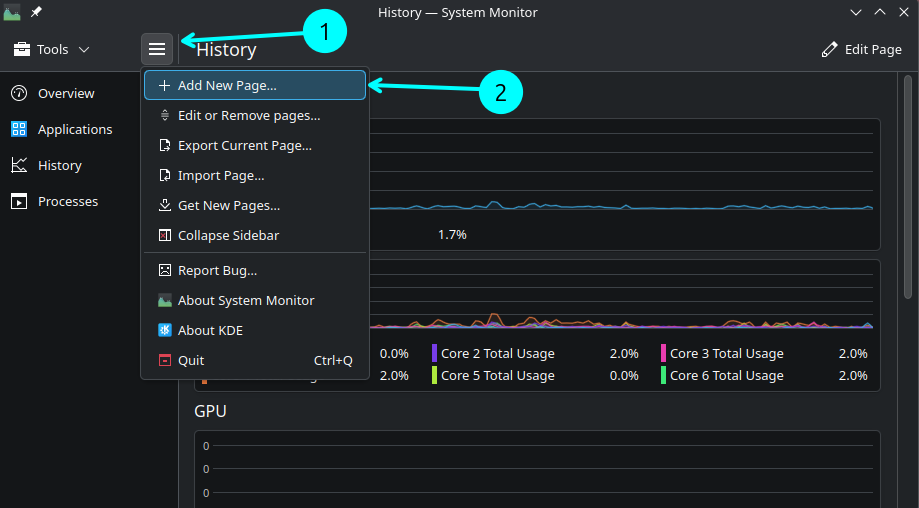
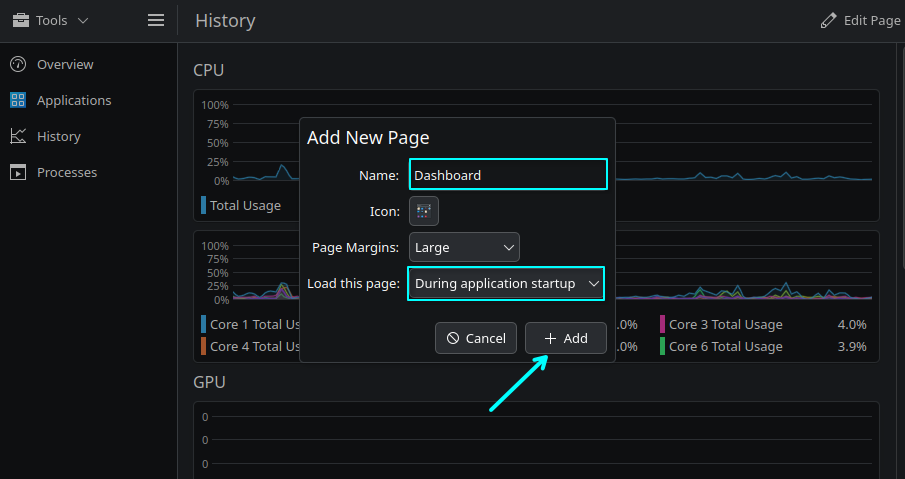
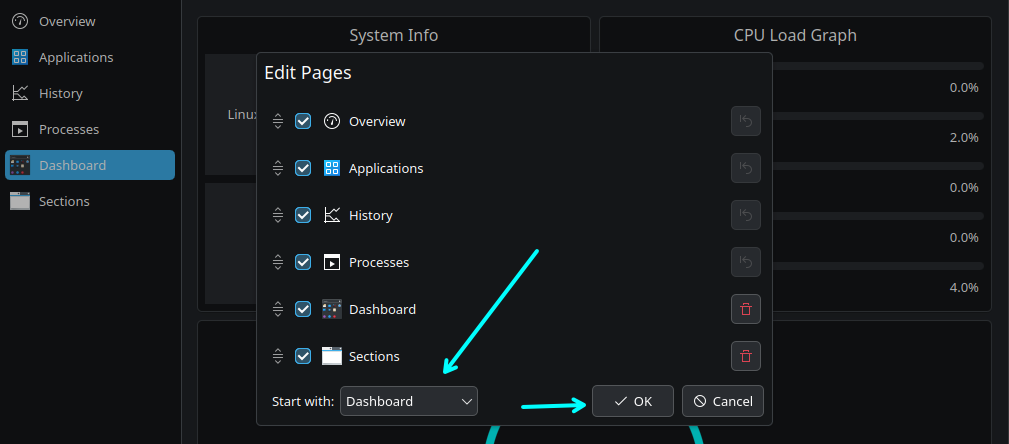
While modifying existing pages is possible, it is often cleaner to start from scratch. To begin, click the menu button in the top-left corner and select Add New Page. You will be prompted to name your dashboard and assign an icon. For power users, we recommend setting "Load this page" to "During application startup." This ensures that your custom, high-priority data is the first thing you see when you open the monitor.
Phase 2: Widget Configuration and Sensor Selection
Once you are on your empty canvas, click the Edit Page button in the top-right corner. This unlocks the true power of the application. By default, you will see a placeholder widget. Clicking it opens the configuration sidebar, which acts as the control panel for your data visualization.
The Sensor Taxonomy:
The effectiveness of your dashboard depends entirely on your sensor selection. KDE categorizes these in a highly intuitive manner:
- CPU/Processor: Look here for individual core usage, clock speed, and thermal statistics.
- Memory (Physical): Provides detailed insights into RAM usage, including cached vs. buffered memory.
- Network/I/O: Essential for tracking bandwidth saturation and disk read/write throughput.
- GPU: Vital for gamers and creative professionals monitoring VRAM and GPU utilization.
When configuring a widget, you will often find two primary fields: the "Sensor" field, which dictates what data is pulled, and the "Display" field, which dictates how that data is rendered (e.g., bar chart, pie chart, or a text-based "color grid").
Phase 3: Advanced Layout Manipulation
To move beyond a simple list of charts, you must master the art of the grid.
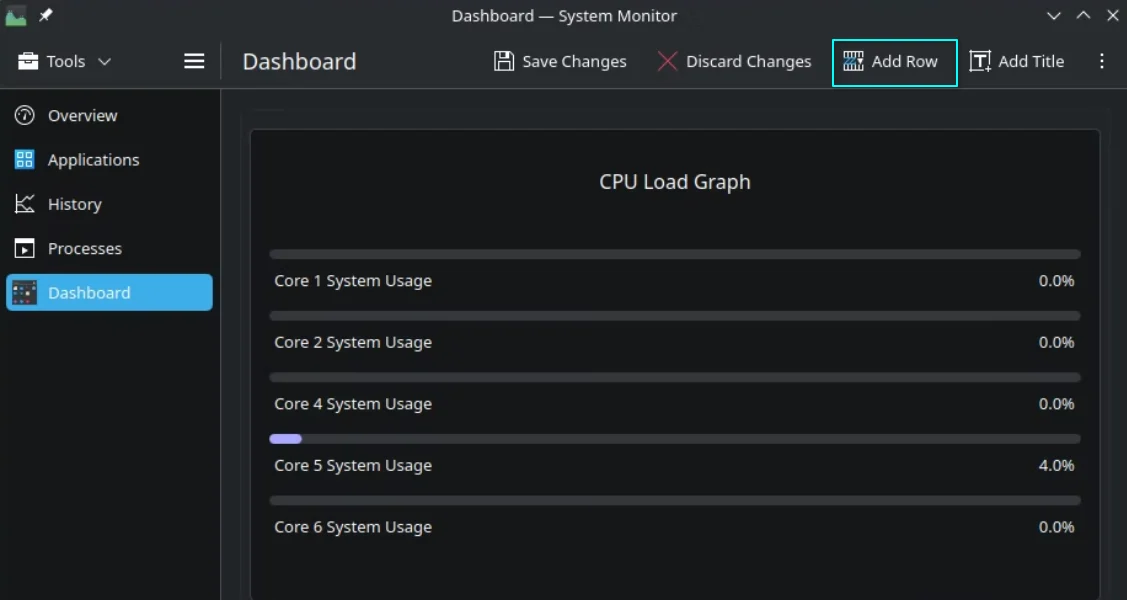
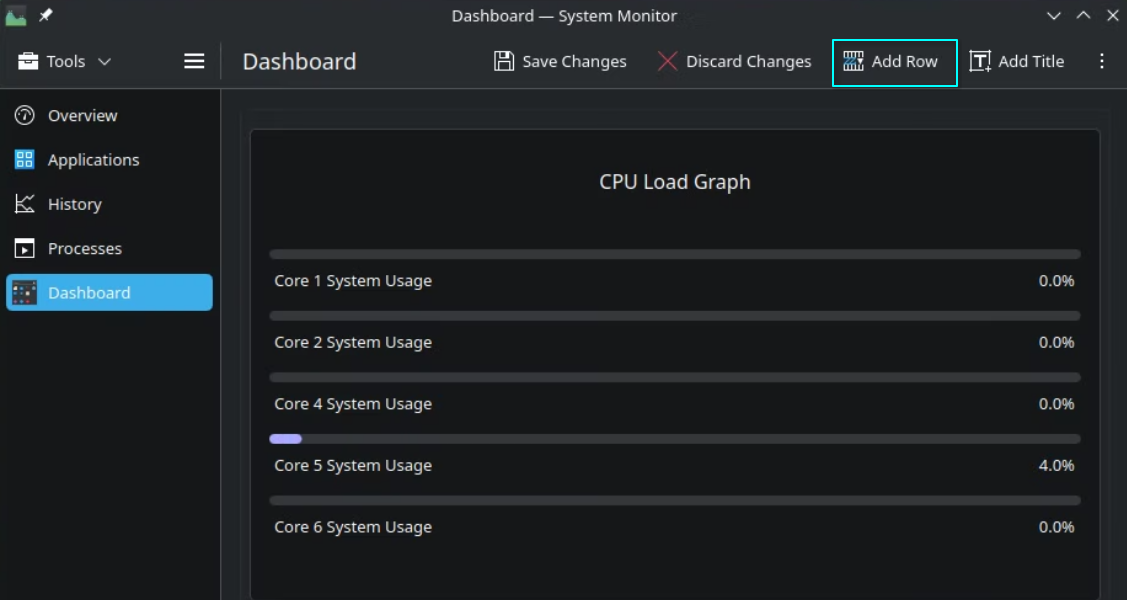
- Adding Rows and Columns: If your dashboard feels cluttered, use the Add Row button to create vertical space. If you want two metrics side-by-side—for example, CPU frequency next to CPU temperature—select the topmost layer of your current widget and choose Add -> Add Column.
- Logical Sectioning: Use the Add Section feature to group related information. For example, create a section titled "Thermal Dynamics" containing both your CPU and GPU temperature sensors, separated by a visual divider (Add -> Add Separator). This provides a clear, logical flow for your eyes to follow.
- Dynamic Rearrangement: If you decide a widget is better suited elsewhere, you do not need to delete and recreate it. Simply click the top of the widget, select Move, and drag it into its new position. The UI will automatically re-flow the remaining widgets to accommodate the change.
Implications for System Maintenance and Workflow
The ability to customize your monitoring environment is not just an aesthetic choice; it has significant implications for how you manage system resources. By creating specialized pages—one for "Gaming/Performance," another for "System Health/Thermals," and a third for "Network/Server Traffic"—you reduce cognitive load. You are no longer sifting through irrelevant system processes to find your disk read speeds; you are glancing at a curated dashboard designed to surface the data that matters most to your specific session.
Furthermore, because these pages can be exported as .page files, you can maintain a standardized monitoring configuration across all your devices. Whether you are managing a powerful desktop, a development laptop, or a secondary home server, you can import your custom dashboard, ensuring a consistent user experience regardless of the hardware.
Community Integration and External Resources
KDE’s open-source ethos extends to the community at large. If you are unsure where to start, you do not have to reinvent the wheel. The "Get New Pages" feature acts as a repository for community-created layouts. These templates often leverage complex combinations of sensors and custom color grids that might not be immediately obvious to the casual user.
A Note on Security: As with any community-contributed content, exercise a degree of caution. While the KDE team works hard to maintain the platform, these files are user-generated. Always inspect the contents of a new dashboard and ensure you are downloading from reputable sources within the KDE Store.
Conclusion: A Tool That Grows With You
The KDE Plasma System Monitor is a rare example of software that respects the user’s intelligence. It does not force a "one-size-fits-all" view on you. Instead, it provides a comprehensive toolkit—rows, columns, sections, and a vast library of sensors—and allows you to dictate the form and function of your own workspace.
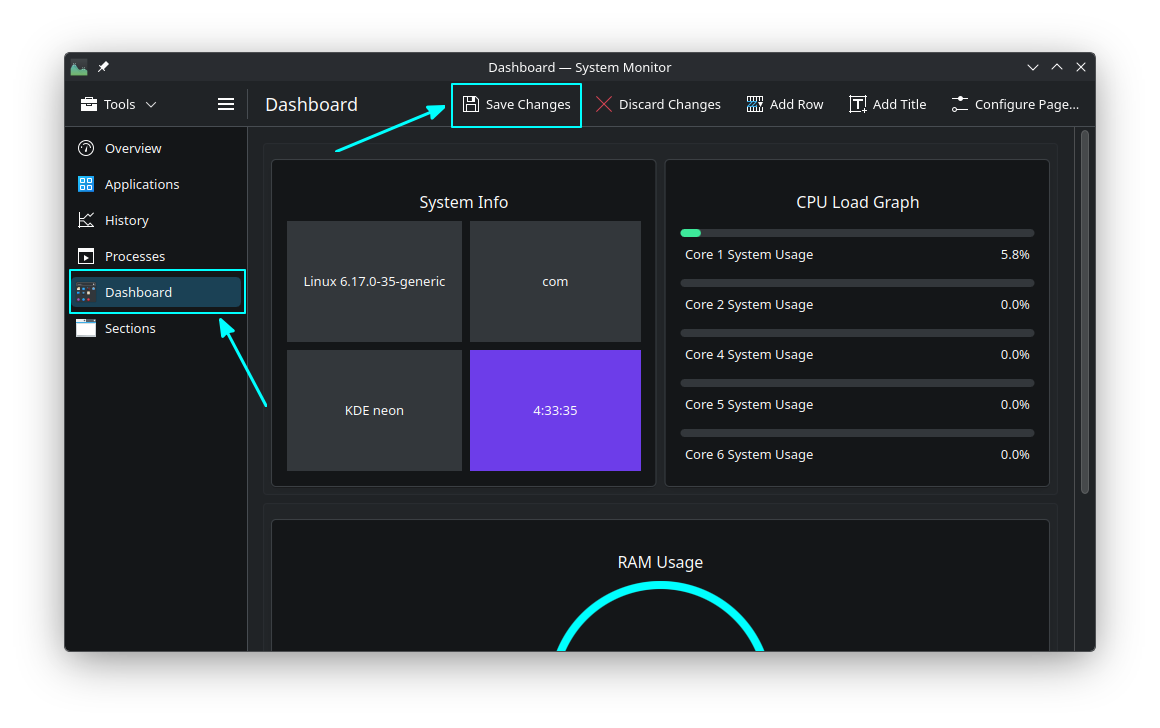
By investing the time to move beyond the default settings, you are not just customizing an app; you are gaining a deeper understanding of your hardware’s performance characteristics. Whether you are a system administrator monitoring server load or a enthusiast trying to squeeze the last bit of performance out of your CPU, the KDE System Monitor provides the clarity you need to succeed.
Have you built a unique dashboard configuration that you rely on daily? The flexibility of the KDE ecosystem thrives on user contributions and shared knowledge. We encourage you to experiment with your layout, save your custom pages, and share your findings with the broader Linux community.