Engineering Efficiency: How TensorFlow Lite Optimized Memory Management for Edge Devices
In the rapidly evolving landscape of machine learning, the deployment of sophisticated models onto resource-constrained edge devices remains a significant engineering hurdle. While TensorFlow Lite (TFLite) has long been the industry standard for delivering high-performance inference on mobile and IoT hardware, the constant pursuit of optimization requires deep dives into the underlying runtime mechanics. A recent technical initiative led by the TensorFlow engineering team has yielded substantial performance gains, specifically targeting the "memory arena"—the critical component responsible for buffer sharing between tensors. By utilizing advanced profiling tools like Simpleperf, engineers were able to slash the overhead of memory allocation, ensuring that more processing power is dedicated to actual model inference rather than housekeeping tasks.
The Core Challenge: Memory Arena Overhead
At the heart of TFLite’s efficiency is its memory arena, a mechanism designed to minimize memory footprints by strategically sharing buffers between tensors. By reusing memory slots that are no longer needed by completed operations, TFLite allows complex models to run on devices with limited RAM. However, this level of sophistication carries a cost. The logic required to manage these allocations—tracking which tensor occupies which memory offset at any given time—introduces runtime overhead.

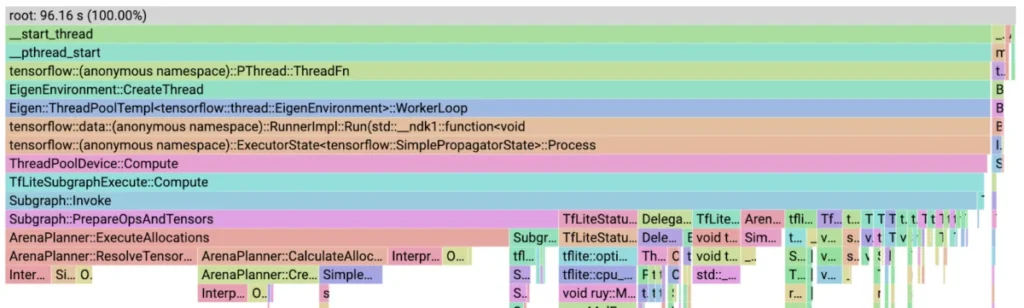
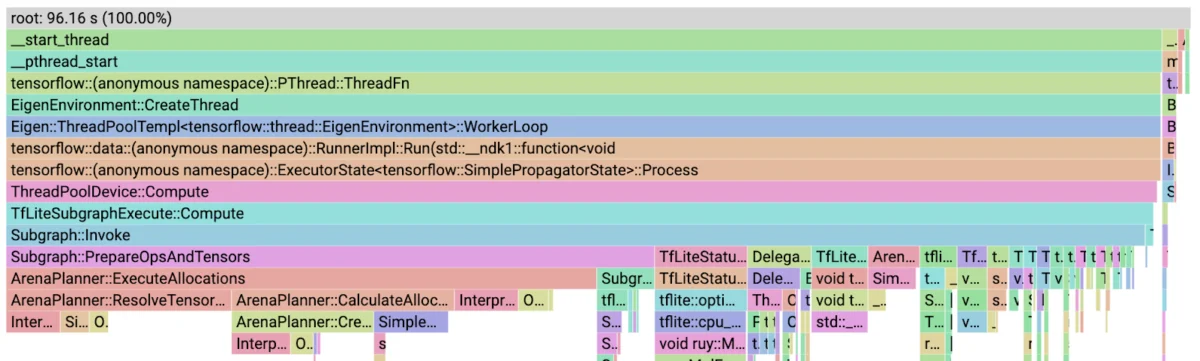
For most standard models, this overhead is negligible. But for architectures featuring dynamic tensor sizes or frequent re-allocations, the memory arena can inadvertently become a performance bottleneck. As the TensorFlow team discovered, in some high-load scenarios, the ArenaPlanner::ExecuteAllocations function accounted for over 50% of the total runtime. This presented a clear objective: optimize the initialization and maintenance of the memory arena to ensure the lightweight nature of TFLite remains a benefit rather than a source of latent performance degradation.
Chronology: A Step-by-Step Optimization Journey
The process of refining TFLite’s performance followed a rigorous methodology centered on observability. The engineers did not rely on intuition; instead, they leveraged the Android NDK’s Simpleperf tool to map the execution paths of their models in real-world conditions.

Phase 1: Identifying the "Low-Hanging Fruit"
Initial profiling sessions using flame graphs revealed surprising inefficiencies. One significant culprit was InterpreterInfo::num_tensors(), which, despite its simple purpose, consumed 10.4% of the runtime. The issue was that the function was virtual and invoked repeatedly within a loop, adding unnecessary overhead. By caching the number of tensors, the team eliminated these redundant calls, providing an immediate performance boost. Similarly, InterpreterInfo::tensor(unsigned long), another frequent, high-cost virtual function call, was replaced with a direct pointer access method. These two foundational adjustments alone reduced the model’s total runtime by 25%.
Phase 2: Refactoring Allocation Logic
With the minor overhead addressed, the team turned their attention to ArenaPlanner::CreateTensorAllocationVector. This function was responsible for determining which tensors required allocation between graph nodes, sorting them by size to facilitate a "Greedy by Size" allocation strategy. By shifting from a dynamic per-node check to a cached mapping approach—where the structure of the graph is pre-calculated—the team reduced the cost of this function from 4.8% to 0.8% of the total runtime.

Phase 3: Streamlining Deallocation
The deallocation process also underwent a major overhaul. Originally, SimpleMemoryArena::Deallocate used an $O(N^2)$ approach, involving frequent calls to std::vector::erase and costly memcpy operations. The team introduced a "lazy" approach: marking records for removal during a single pass and then clearing them collectively using std::remove_if. Furthermore, they introduced SimpleMemoryArena::DeallocateAfter(int32_t node), which allowed the system to clear tensors in a batch based on the node sequence, reducing the complexity to $O(N)$ and effectively removing the function from the performance profile entirely.
Phase 4: Data Structure Re-evaluation
Perhaps the most counter-intuitive finding occurred when the team attempted to replace the std::vector used for storing allocation records with an std::multimap to improve search speeds. Despite the theoretical benefits of the map’s $O(log N)$ complexity, the implementation proved three times slower than the original vector. This served as a vital reminder that in high-performance computing, the constant factors—such as cache locality and iteration speed—often outweigh theoretical complexity gains. The team stuck with the vector but optimized how it was processed.

Supporting Data and Technical Context
The transformation of the performance profile is striking. Before these optimizations, memory management tasks were responsible for nearly 50% of the device’s workload during inference. Post-optimization, that figure dropped to roughly 6%, effectively shifting the "heaviest" part of the workload back to the actual neural network operators (like convolutions and fully connected layers).
This success was facilitated by Simpleperf, which allowed the engineers to generate perf.data files and visualize them using pprof. By pulling data directly from the development device to a local machine, the team could generate flame graphs that clearly illustrated where CPU cycles were being wasted. The use of the Android NDK and adb connectivity provided a standardized environment, ensuring that the optimizations were reproducible and measurable across various hardware configurations.

Official Perspective on the Results
The TensorFlow engineering team views these improvements not just as a set of code patches, but as a validation of the importance of profiling in production environments. "Simpleperf made identifying these inefficiencies easy," the team noted in their post-release technical briefing. By making the ArenaPlanner more intelligent, they have ensured that the memory arena scales gracefully even as model architectures become more complex.
These changes were officially merged and released in TensorFlow 2.13. The team emphasizes that while their specific focus was on the memory arena, the methodology—profiling, identifying bottlenecks, and validating through iteration—is a blueprint that developers can and should apply to their own custom pipelines.

Implications for Future Edge Deployment
The implications of these optimizations are twofold. First, they enhance the capability of developers to run larger, more sophisticated models on low-power hardware without sacrificing inference speed. Second, they highlight a critical shift in how we think about ML runtimes: it is no longer enough for an inference engine to be "fast." To truly compete in the edge-AI market, runtimes must be "lean" in their own management overhead.
As machine learning models continue to trend toward dynamic graphs and variable input sizes, the demand for an efficient, low-overhead memory allocator will only increase. By reducing the reliance on std::vector::erase and minimizing the use of virtual functions in critical loops, the TensorFlow team has set a high bar for runtime performance.

For developers working with TFLite, the message is clear: when building high-performance on-device pipelines, do not assume that the bottleneck is within your model’s layers. Use profiling tools to inspect the runtime’s internal management systems. Often, the most significant performance gains are found in the overlooked "utility" functions that manage the resources upon which your neural network relies. As we move toward a future of increasingly ubiquitous on-device intelligence, these microscopic optimizations represent the macroscopic difference between a sluggish application and a seamless, real-time user experience.