Mastering Data Visualization: How to Unlock the Full Potential of the Arduino Serial Plotter
In the world of embedded systems and rapid prototyping, the ability to visualize real-time data is not just a luxury—it is a fundamental requirement for debugging and signal analysis. For millions of hobbyists and professionals alike, the Arduino IDE’s built-in Serial Plotter has long served as the primary window into the soul of their microcontrollers. Yet, despite its utility, the tool is often criticized for its rigid default settings. Specifically, the dynamic scaling of the X and Y axes in Arduino IDE 2.0 and later versions can render complex signal analysis frustratingly opaque.
This article serves as a comprehensive technical guide to overcoming these limitations. By manipulating the IDE’s underlying architecture, we can transcend the default constraints, enabling a more robust, stable, and insightful data visualization experience without the overhead of external software like Python or Processing.
Main Facts: The Limitation of Dynamic Scaling
The Arduino Serial Plotter is designed for simplicity. In its default state, the IDE automatically manages the coordinate system of your graphs. While this "plug-and-play" functionality is ideal for beginners looking to see a quick pulse or a temperature spike, it poses significant challenges for advanced data analysis.
The X-Axis Bottleneck
In Arduino IDE 2.x, the X-axis is hard-coded to display a rolling window of exactly 50 data points. As new data arrives, the oldest points are discarded, creating a "sliding" effect. While this provides a smooth view of instantaneous changes, it is detrimental when you need to observe long-term trends, signal decay, or comparative periodic waveforms.
The Y-Axis Fluctuation
The Y-axis is equally restrictive. It dynamically scales to fit the minimum and maximum values currently present within that 50-point window. If your signal has even minor noise or jitter, the Y-axis range will constantly stretch and compress, making it nearly impossible to visually assess the true magnitude of a signal. For developers working on control systems or sensors requiring high precision, this "dancing" graph is a major impediment to accurate diagnostic work.
Chronology: The Evolution of the Arduino IDE
To understand why these settings are hidden, one must look at the evolution of the Arduino ecosystem.
- The Early Days (IDE 1.x): The original Serial Plotter was a rudimentary utility. It lacked the aesthetic polish of modern versions but was widely understood as a "black box" tool that users had to accept as-is.
- The Shift to IDE 2.0: With the release of the IDE 2.0, built on the Theia framework and Electron, the architecture became significantly more modular. While this improved the user experience, the frontend visualization components—built largely using web technologies like JavaScript—became more complex to modify.
- The Community Discovery Phase: As the IDE gained traction, the developer community began exploring the source files. It was discovered that the "Plotter" is essentially a web-based component rendered within the IDE, meaning that specific configuration files are stored in plaintext, waiting to be unlocked by those who know where to look.
Supporting Data: Why Precision Matters
Consider a standard sine wave generated by an Arduino. Using the following code, you can witness the instability of the default settings:
float t;
float y;
void setup()
  Serial.begin(115200);


void loop()
  t = micros() / 1.0e6;
  y = sin(2 * PI * t);
  Serial.println(y);
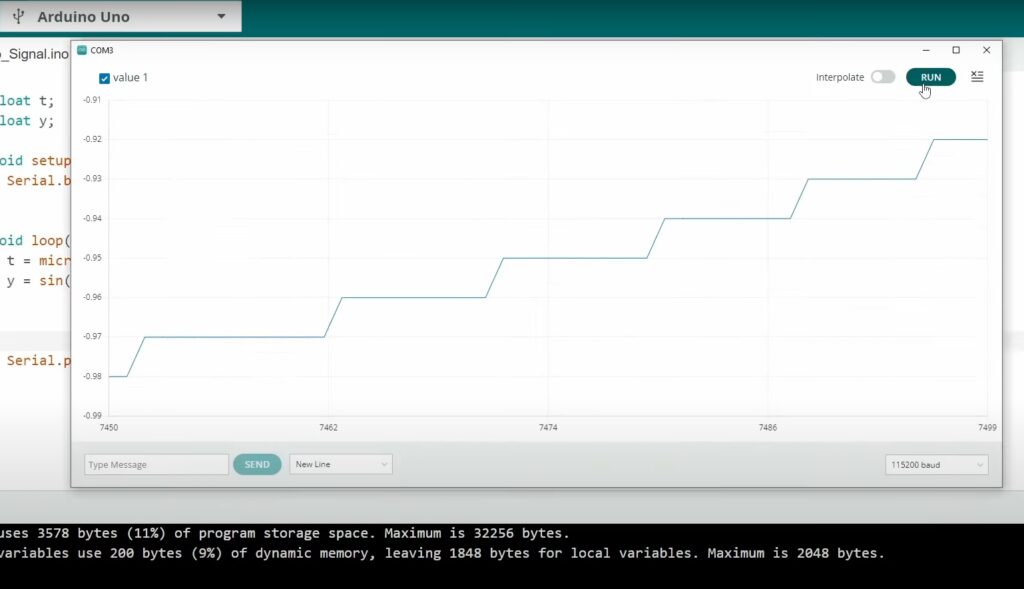
When running this, the plotter will struggle to maintain a consistent view. The Y-axis will constantly adjust its bounds to accommodate the floating-point noise, and the 50-point X-axis limit will cause the wave to scroll by too quickly for meaningful pattern recognition.
Case Study: Signal Stabilization
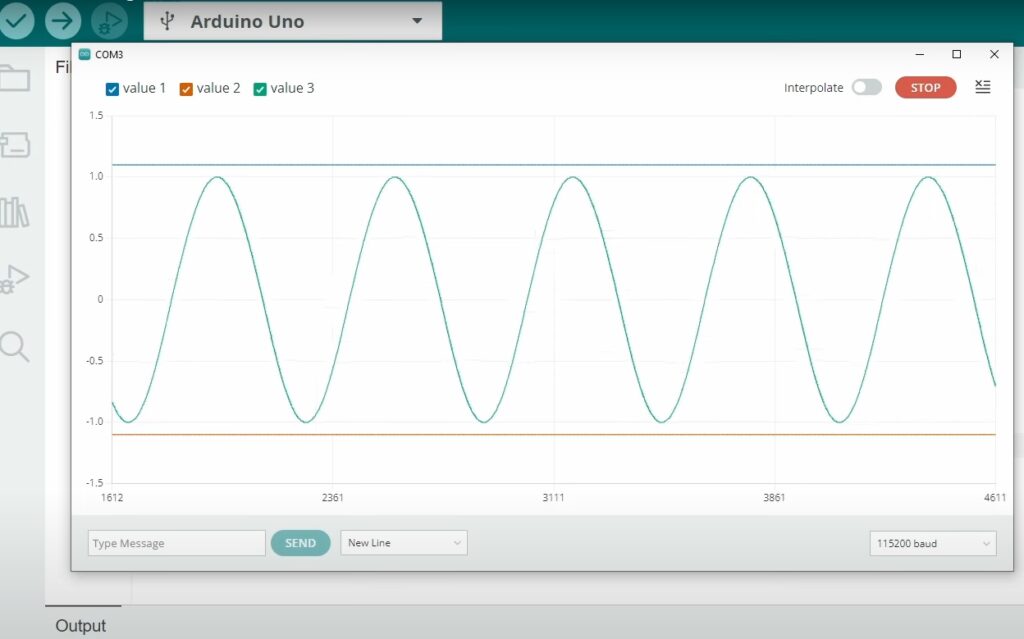
To stabilize the Y-axis, one must introduce "anchor" values. By forcing the plotter to register values slightly outside your expected range, you effectively lock the scale.
void loop()
  t = micros() / 1.0e6;
  y = sin(2 * PI * t);
  Serial.print("1.1, ");
  Serial.print("-1.1, ");
  Serial.println(y);
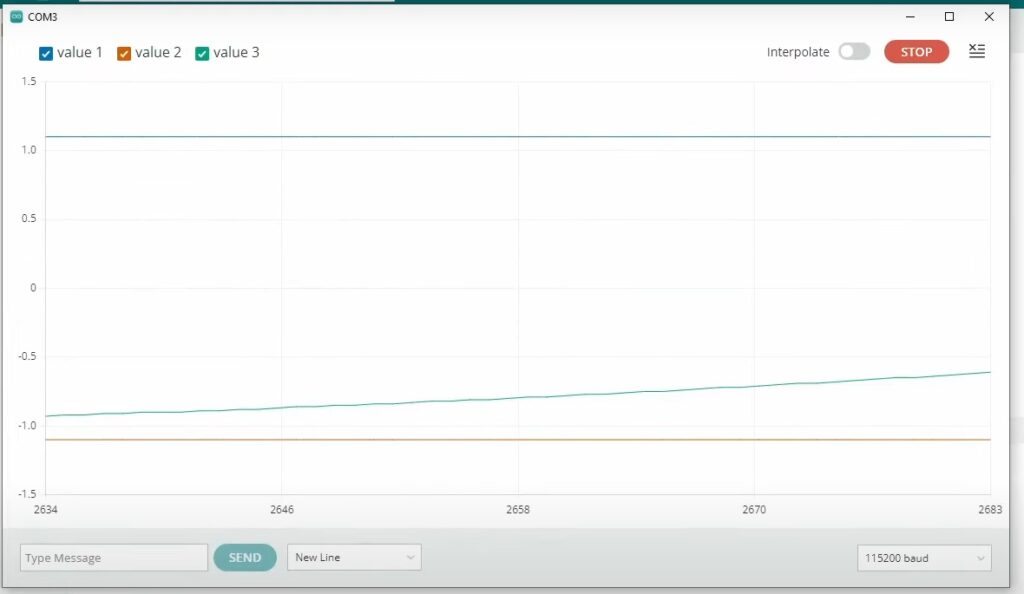
By printing these two constant values alongside your variable y, the Serial Plotter is forced to set its Y-range to at least 1.1 and -1.1. This simple trick provides the baseline stability required for professional-grade observation.
The Technical Solution: Unlocking the X-Axis
If you require a wider view—for instance, 500 data points instead of 50—you must edit the IDE’s core configuration files.
Step-by-Step Configuration
- Locate the IDE Installation: On Windows, this is typically found in
C:Users[YourUsername]AppDataLocalArduino15packagesarduinotoolsarduino-ide. - Find the Configuration File: Navigate through the file structure to find the file named
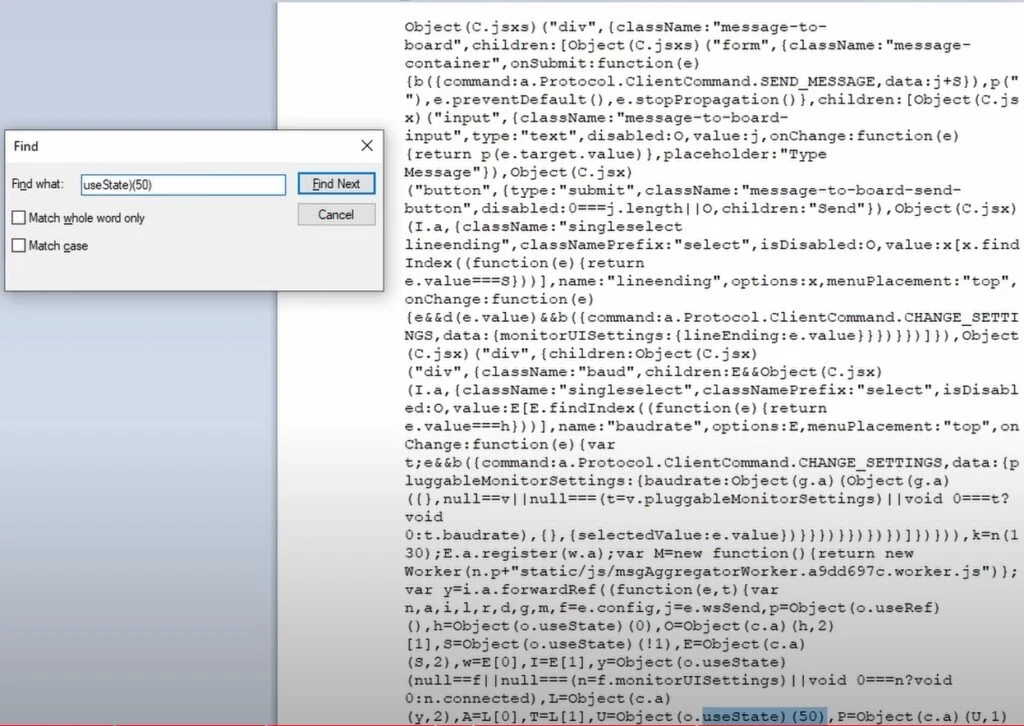
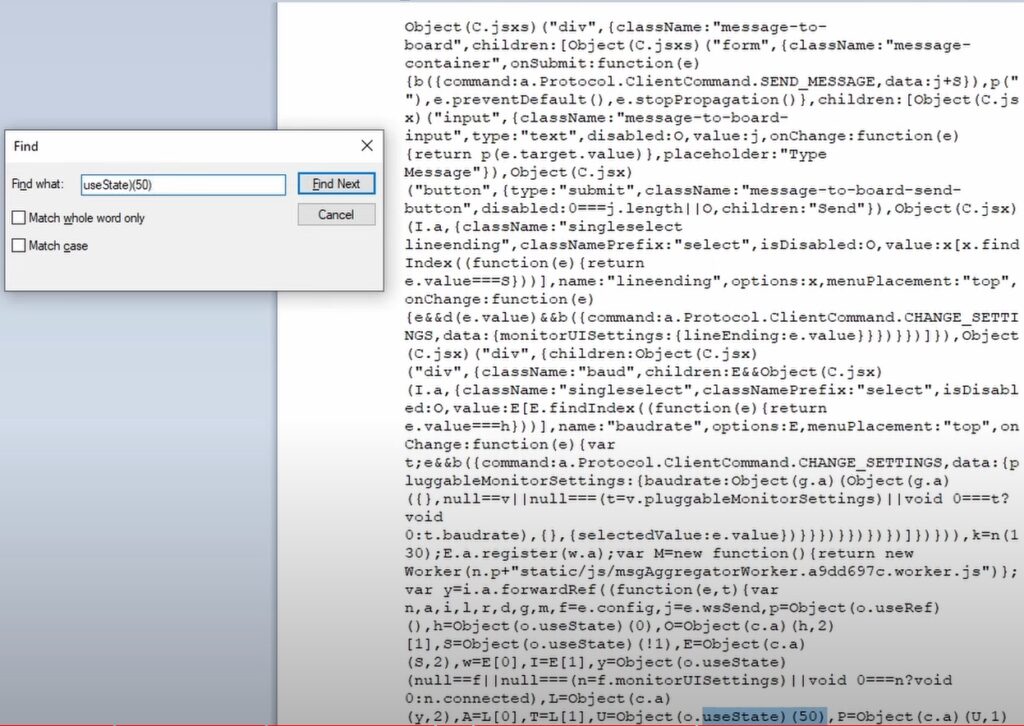
main.35ae02cb.chunk.js. This is the file that governs the plotter’s frontend behavior. - Edit the JS File: Use a text editor (like VS Code or Notepad++) to open the file. Search for the integer
50. You will likely find a line that defines the buffer size or the maximum display points. Change this value to your desired length (e.g.,500). - Restart the IDE: Once saved, restart the Arduino IDE to apply the changes.
Warning: Increasing this value beyond a certain point—usually around 5,000 points—can cause the UI to stutter, as the browser-based rendering engine within the IDE is not optimized for high-density, high-frequency plotting.
Implications: The Future of Embedded Diagnostics
The ability to tweak these settings carries significant implications for the Arduino community.
Improved Workflow Efficiency
By modifying these files, engineers can perform faster A/B testing on sensor arrays. Instead of needing to export data to Excel or write a custom Python script using Matplotlib to visualize a signal, they can keep their workflow entirely within the IDE. This reduces the "context switching" that often slows down development cycles.
The Trade-off of Customization
However, there is a caveat. Because these modifications involve editing the IDE’s core files, they are not permanent. An official Arduino IDE update will likely overwrite your changes, resetting the plotter to its default state. This requires users to maintain a "patch" or a script to re-apply their settings after every IDE update.
When to Seek Advanced Alternatives
While these "hacks" extend the utility of the Serial Plotter, they are not a replacement for professional data acquisition software. If your project involves high-speed sampling (e.g., above 10kHz), multi-channel analysis with complex trigger conditions, or long-term data logging to CSV/SQL, you should transition to:
- Python (PySerial + Matplotlib/Plotly): Offers infinite customization and high-performance processing.
- Processing: The "sibling" language to Arduino, perfect for custom, lightweight UI dashboards.
- Serial Plotter (External Software): Dedicated tools like SerialPlot or Teleplot offer far more robust feature sets than the IDE’s built-in tool.
Conclusion
The Arduino Serial Plotter is a powerful, albeit opinionated, tool. While its default settings are designed to ensure the IDE remains accessible to beginners, those willing to explore the directory structure and manipulate the underlying JavaScript can unlock a level of control previously thought impossible.
By stabilizing the Y-axis through anchor values and extending the X-axis through file modification, you can transform your debugging process. Whether you are observing the heartbeat of a sensor or the oscillating output of a PWM signal, these techniques ensure that you are no longer fighting the tool, but rather, leveraging it as a professional-grade instrument.
As always, keep your workspace organized, document your modifications, and continue pushing the boundaries of what your Arduino can achieve. Happy coding!