Mastering the Arduino Serial Plotter: A Guide to Customizing Your Data Visualization
The Arduino Serial Plotter is a cornerstone tool for makers, engineers, and hobbyists. It offers an immediate, low-latency window into the data streaming from microcontrollers. Whether you are debugging a sensor array, tuning a PID controller, or visualizing a complex mathematical function, the Plotter provides the feedback loop necessary to iterate quickly.
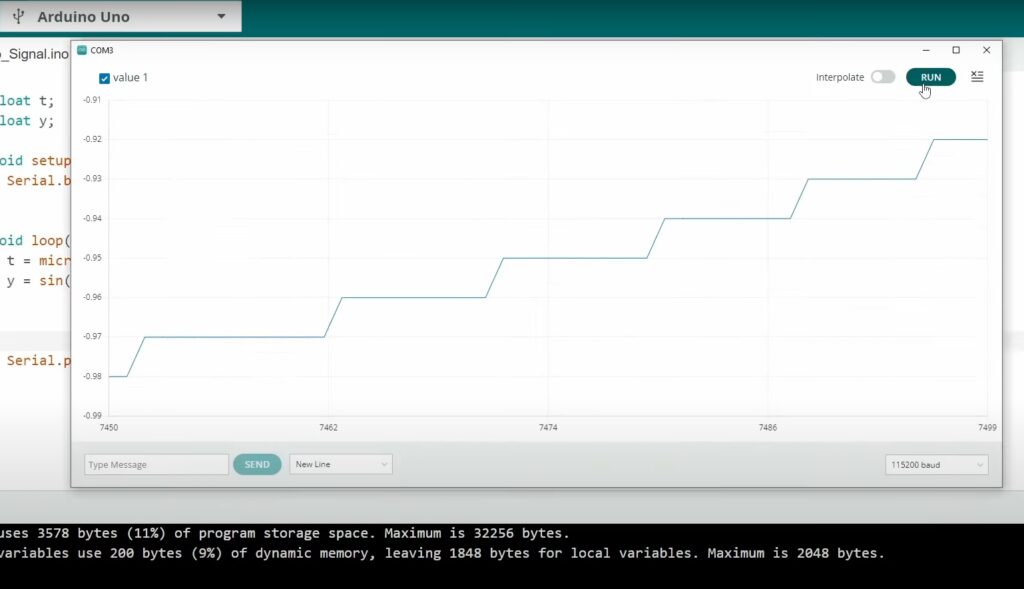
However, as many power users have discovered, the tool is not without its frustrations. Specifically, the default configuration in Arduino IDE 2.x imposes rigid limitations on axis scaling. With a fixed X-axis window of 50 data points and a dynamic, auto-scaling Y-axis, users often find themselves staring at jittery, unreadable waveforms that lack the necessary context for deep analysis. While external solutions like Python’s Matplotlib or dedicated software like Processing exist, they often introduce unnecessary overhead. This article explores how to take full control of the Arduino Serial Plotter, effectively "hacking" its configuration to achieve professional-grade data visualization.
Main Facts: The Limitation of the Default Environment
The Serial Plotter, since the release of the Arduino IDE 2.0, has undergone significant architectural changes. It moved from a simple Java-based display to a modern, web-technology-driven interface. While this improved responsiveness and aesthetic, it sacrificed the granular user-adjustable settings found in other professional data loggers.
The core issue is twofold:
- The X-Axis Bottleneck: By default, the plotter displays only the most recent 50 data points. In high-frequency signal monitoring, this creates a "scrolling" effect that is too fast to interpret, effectively hiding long-term trends or periodic patterns.
- Dynamic Y-Axis Jitter: Because the Y-axis constantly rescales to fit the range of the current 50 points, a signal that should be stable can appear to "bounce" up and down, making it impossible to gauge true amplitude fluctuations or noise floors.
For developers working on signal processing or system stabilization, these defaults are not just inconvenient—they are obstacles to meaningful progress.
Chronology: The Evolution of IDE 2.0 and the "Hidden" Config
The shift to the electron-based Arduino IDE 2.0 was intended to bring the platform into the modern era of software development. It introduced advanced features like autocompletion and cloud integration. However, in the process of streamlining the UI, the developers relegated several configuration parameters to internal JavaScript files rather than the user settings menu.
Historically, users relied on community-made patches to fix these visual limitations. In late 2023 and throughout 2024, the developer community began reverse-engineering the internal structure of the IDE. By identifying the specific chunk files that control the plotter’s rendering logic, users discovered they could override these defaults by manually editing the source code that powers the IDE’s front end. This process, while "unofficial," has become the gold standard for those seeking to unlock the full potential of their hardware diagnostics.
Supporting Data: Why Scaling Matters
Consider the simple task of monitoring a sine wave generated by your Arduino. Using the standard code:
float t; float y;
void setup()  Serial.begin(115200);
void loop()
  t = micros() / 1.0e6;
  y = sin(2 * PI * t);
  Serial.println(y);
In the default IDE 2.0 settings, the Y-axis will constantly adjust to whatever the local minimum and maximum are within the last 50 samples. If your signal has even a tiny bit of noise, the plot will look like a chaotic, jumping mess rather than a smooth, predictable wave.
By forcing the scale, you gain the ability to see the "big picture." This is critical for tasks such as:
- Sensor Calibration: Seeing the true relationship between a raw sensor value and its physical counterpart.
- Control Systems: Observing how a motor or heating element responds to changes over several seconds, rather than milliseconds.
- Algorithm Validation: Checking if a filter (like a moving average) is effectively smoothing out the signal over a long duration.
The Technical Solution: Step-by-Step Customization
1. Stabilizing the Y-Axis
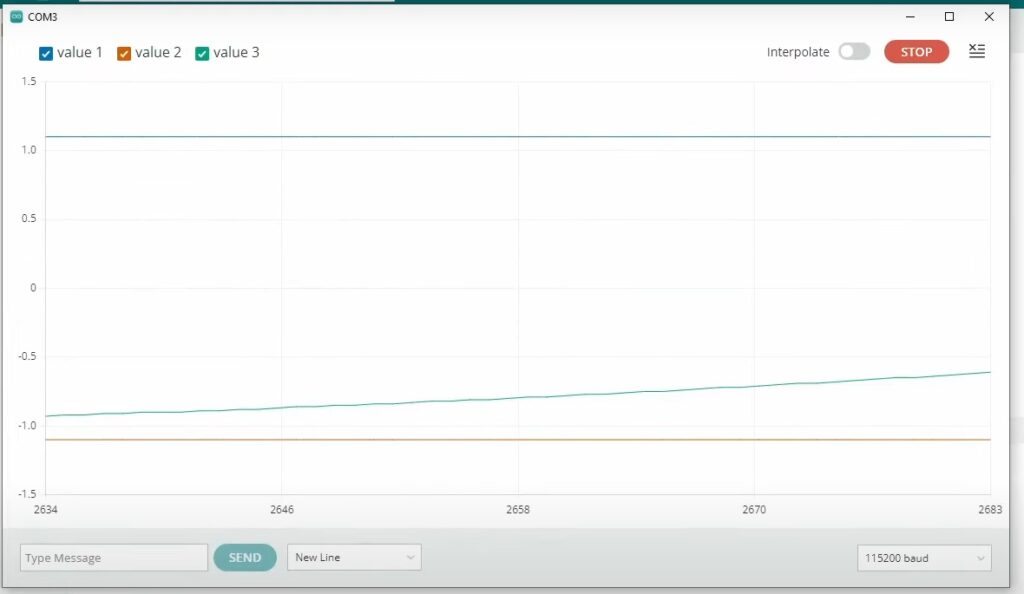
The simplest way to stabilize the Y-axis without editing system files is through "data anchoring." By printing constant values alongside your variable, you force the auto-scaler to accommodate the full range you define.
Modify your code as follows:
void loop()
  t = micros() / 1.0e6;
  y = sin(2 * PI * t);
  Serial.print("1.1, "); // Constant max anchor
  Serial.print("-1.1, "); // Constant min anchor
  Serial.println(y);
By adding these fixed points, the plotter treats them as the boundaries of the graph, forcing the Y-axis to stay locked between 1.1 and -1.1.
2. Increasing the X-Axis Scale
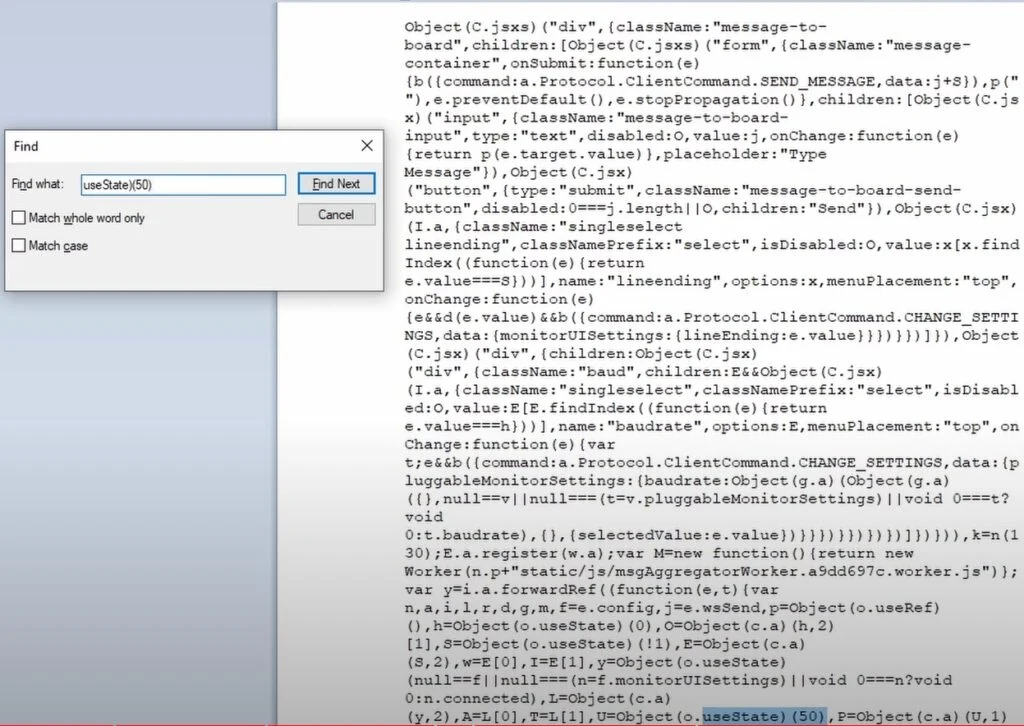
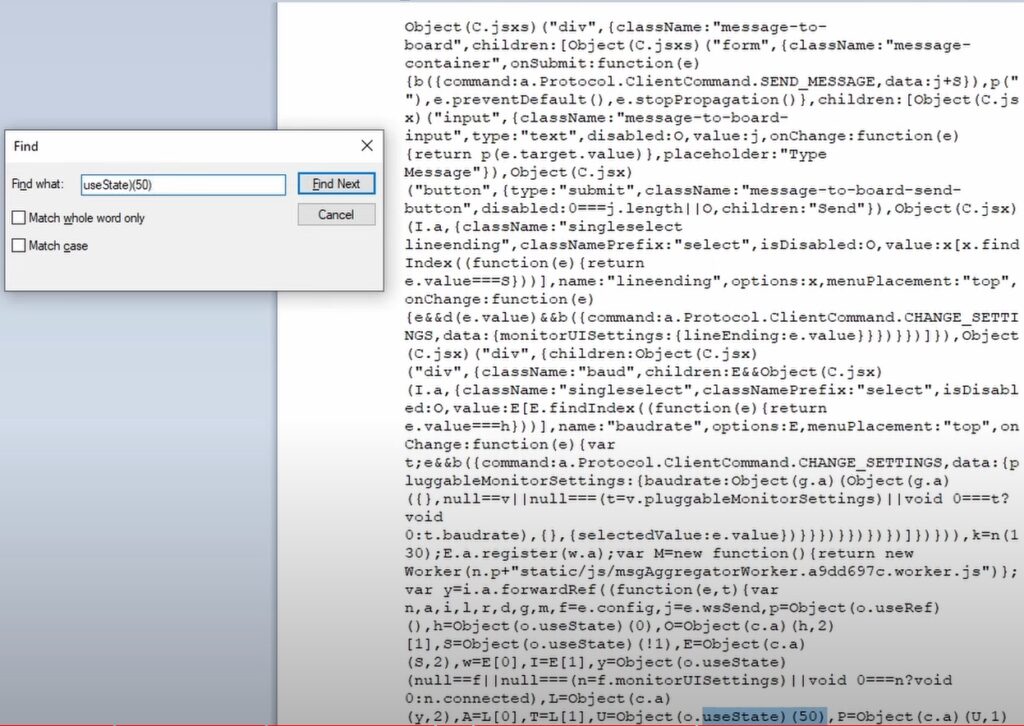
To change the 50-point limit, you must modify the internal JavaScript files of the Arduino IDE.
Step A: Locate the File
On Windows, navigate to your Arduino IDE installation folder (typically C:Users[User]AppDataLocalProgramsArduino IDEresourcesapplibfrontend). Within this directory, look for the file named main.[unique_hash].chunk.js.
Step B: Edit the Configuration
Open this file using a code editor like VS Code or Notepad++. Search for the number 50. You will likely find a line of code that looks like a limit definition for the plotter’s data array. Change this value to your desired window size—for example, 500 or 1000. Save the file and restart the Arduino IDE.
3. Verify and Fine-Tune
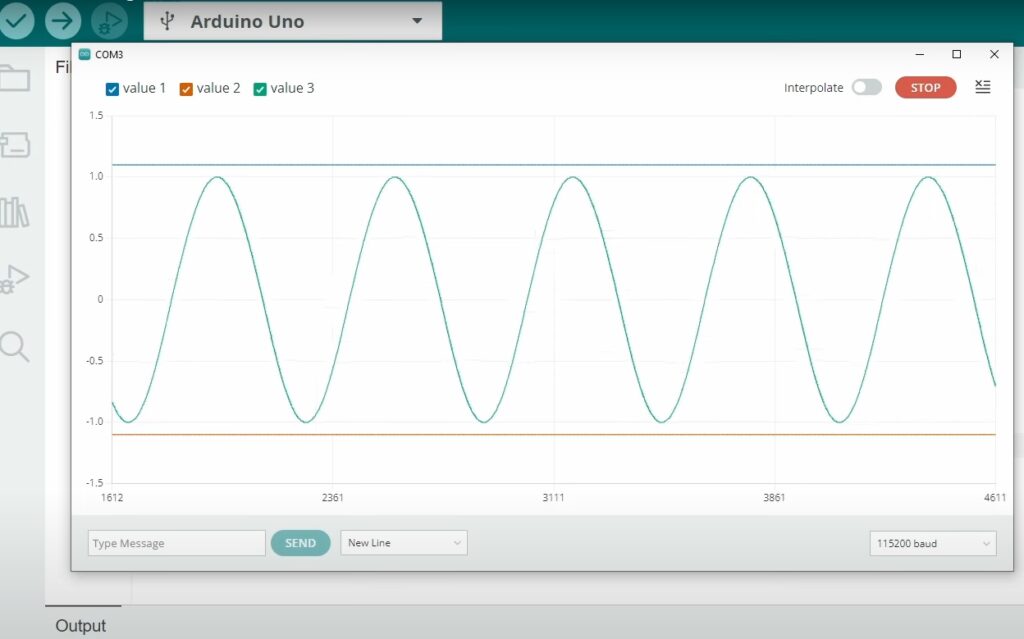
Once you restart the IDE, the Serial Plotter will begin buffering the number of points you specified. If you chose 500, you will immediately notice a much wider, more stable view of your signal.
Implications and Warnings: Understanding the Trade-offs
While increasing the X-axis limit provides a clearer view, it is not without cost.
- Memory and Performance: The Arduino IDE 2.0 relies on your computer’s RAM to buffer the serial data. Setting an excessively high X-axis limit (e.g., 5000+ points) will consume more memory and may lead to UI stuttering or "hanging."
- Data Overload: If your Arduino is sending data at a very high baud rate (e.g., 115200 or higher), the sheer volume of data packets can overwhelm the plotter’s ability to render them. You may find that the plotter "stops" or creates gaps in the graph if the rendering engine cannot keep up with the incoming stream.
- Version Fragility: These edits are not officially supported. Every time you update your Arduino IDE, these JavaScript files will be overwritten, and you will need to re-apply your changes. It is highly recommended to keep a backup of your modified file in a separate folder.
Official Responses and Future Outlook
Arduino developers have acknowledged the community’s desire for more robust plotting features. In recent developer forums, there has been discussion regarding the integration of a more flexible "Plotter Configuration" menu in future updates of the IDE. While the official stance remains that the Serial Plotter is a "lightweight" tool, the overwhelming demand for professional-grade visualization suggests that a more modular approach to the plotter UI is on the roadmap.
Until such a feature is officially implemented, the "manual edit" method remains the most effective way for professionals to maintain a high-quality development workflow.
Conclusion
The ability to visualize data is the difference between guessing why a system fails and knowing exactly how it behaves. While the default settings of the Arduino Serial Plotter are designed for simplicity, they can be a hindrance to those conducting rigorous analysis. By using Y-axis anchoring and modifying the IDE’s internal JavaScript configuration, you can transform a basic utility into a powerful, custom-scaled data visualization dashboard.
As you integrate these techniques, remember that clear data is the foundation of good engineering. Whether you are building a home weather station or a high-precision industrial controller, the time spent configuring your tools is an investment in the reliability of your final product. Happy coding, and may your signals always be clean and your waveforms perfectly scaled.