Unlocking Peak Performance: How TensorFlow Lite Slashed Memory Arena Overhead by Over 40%
By Alan Kelly, Software Engineer
Published in partnership with the TensorFlow Core Engineering Team
Main Facts: The Cost of Edge Efficiency
Deploying machine learning (ML) models directly onto resource-constrained edge devices—such as smartphones, IoT gadgets, and microcontrollers—requires a delicate balancing act. Developers must minimize memory footprints without introducing crippling performance overheads. TensorFlow Lite (TFLite) has long been a gold standard for on-device inference, largely due to its lightweight architecture and efficient memory management strategies.
In a previous deep dive, Optimizing TensorFlow Lite Runtime Memory, the TensorFlow engineering team explored how TFLite utilizes a custom memory arena to minimize RAM usage by dynamically sharing buffers across tensors. While this innovation allowed complex neural networks to run on diminutive hardware, it introduced a hidden cost: initialization and execution overhead.
Recent profiling reveals a startling reality: in worst-case scenarios involving models with dynamic input sizes and frequent tensor re-allocations, the memory arena’s management code consumed an astonishing 54.3% of the total runtime. Machine learning operators—such as convolutions and fully connected layers—were frequently sidelined by internal runtime bookkeeping.

To rectify this, the TensorFlow team embarked on a rigorous performance optimization campaign using Android’s Simpleperf profiling tool and Google’s pprof visualization suite. By systematically identifying algorithmic bottlenecks, eliminating redundant virtual function calls, and refactoring tensor deallocation logic, engineers successfully drove the memory arena’s overhead down to just 6%. These vital performance upgrades are now officially available to the global developer community as part of TensorFlow 2.13.
Chronology of an Optimization Campaign: From Bottleneck to Breakthrough
The journey to a leaner TFLite runtime was not achieved through guesswork, but through empirical profiling on physical target devices. The optimization process followed a precise, iterative timeline of discovery, measurement, and refactoring.
Phase 1: Profiling the Baseline with Simpleperf
To understand where execution time was truly being lost, the team deployed Simpleperf on target Android hardware using representative workloads. The profiling pipeline required establishing a connection via Android Debug Bridge (adb), pushing binaries to the device, and generating a performance data log (perf.data).
Using the Android NDK, developers extracted binary caches and transformed the raw performance data into a protocol buffer readable by pprof:

# Record performance data on the target device
/usr/lib/android-ndk/simpleperf/run_simpleperf_on_device.py record --call-graph fp /data/local/tmp/my_binary arg0 arg1 …

# Pull the performance log back to the development workstation
adb pull /data/local/tmp/perf.data

# Build the binary cache and generate the visualization proto
/usr/lib/android-ndk/simpleperf/binary_cache_builder.py -lib /your/binarys/folder -i perf.data
/usr/lib/android-ndk/simpleperf/pprof_proto_generator.py --ndk_path=/path/to/android-ndk -i perf.data -o profile.proto

# Launch the pprof web interface for flame graph analysis
pprof -http :8888 profile.proto
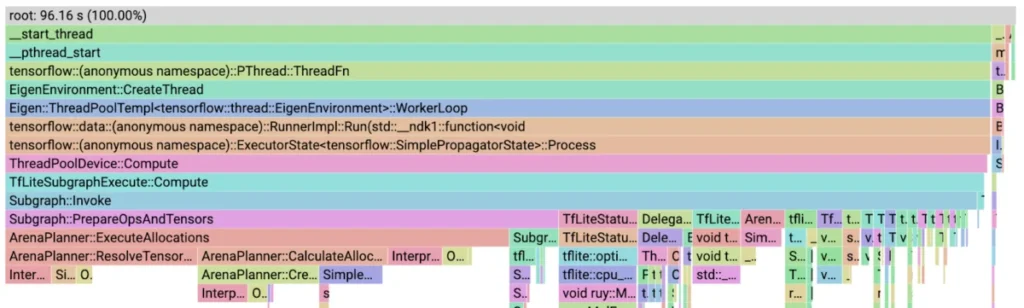
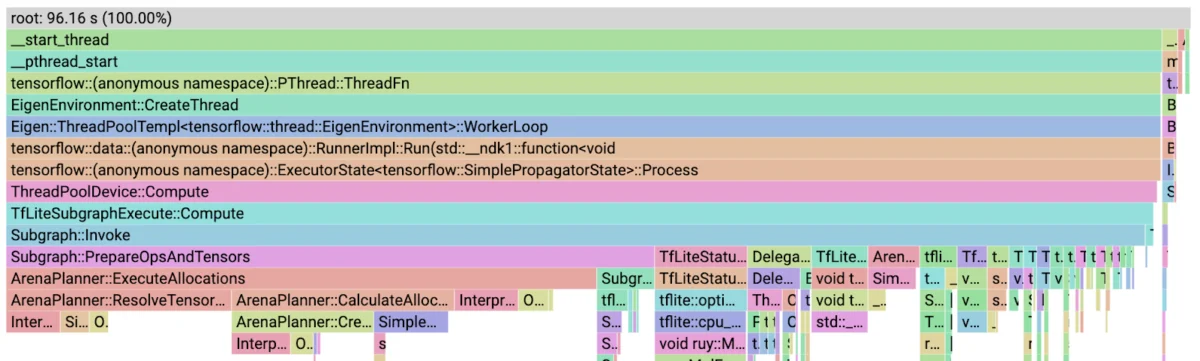
When the resulting flame graphs were rendered in the browser, the findings were counterintuitive. Rather than heavy matrix multiplications or activation functions dominating the chart, ArenaPlanner::ExecuteAllocations accounted for over 54% of execution time in dynamic models.
Phase 2: Eliminating Virtual Function Overhead in Loops
Drilling down into the initial flame graphs revealed that InterpreterInfo::num_tensors() was consuming 10.4% of total runtime. Because the function was virtual, it triggered indirect function calls inside a tight loop that queried tensor properties.
// Before: Virtual function evaluated inside a loop condition
for (int i = 0; i < static_cast<int>(graph_info_->num_tensors()); ++i)
  // ...
Because the arena planner does not mutate the total count of tensors during an execution pass, this value is inherently constant. Caching the tensor count prior to loop execution instantly slashed overhead:
// After: Caching the constant value
const int num_tensors = static_cast<int>(graph_info_->num_tensors());
for (int i = 0; i < num_tensors; ++i)
  // ...
A similar optimization targeted InterpreterInfo::tensor(unsigned long), replacing repetitive bounds-checking virtual calls with a direct pointer accessor to the underlying array. Together, these two trivial-seeming modifications reduced overall model runtime by 25% and cut memory allocator overhead in half.

Phase 3: Refining Allocation Vectors and Resolution Logic
With the low-hanging fruit harvested, ArenaPlanner::CalculateAllocations stepped up as the primary performance bottleneck (12.7% of runtime). This function relied on ArenaPlanner::CreateTensorAllocationVector, which dynamically identified tensors allocated between graph nodes and sorted them by size to satisfy a Greedy-by-Size allocation algorithm.
Because the underlying neural network graph structure is static, the team replaced real-time node-by-node tensor scans with a pre-calculated map of tensors associated with each execution node. This change dropped the cost of CreateTensorAllocationVector from 4.8% down to 0.8%.
Next, ArenaPlanner::ResolveTensorAllocation—responsible for resetting data pointers post-allocation—was scrutinized. Because these memory addresses rarely change during steady-state execution, the team implemented a change tracking mechanism to update only modified pointers, effectively causing ResolveTensorAllocation to vanish from the profile entirely.
Phase 4: Rethinking Deallocation and Asymptotic Complexity
The final frontier involved SimpleMemoryArena::Allocate and SimpleMemoryArena::Deallocate, which accounted for roughly 7% and 6.8% of runtime respectively.

Initially, allocations were managed using a std::vector ordered by memory arena offsets, leading to $O(N)$ complexities for insertions and searches. Counterintuitively, migrating this structure to a std::multimap or std::list actually made the code three times slower due to poor cache locality and high constant factors associated with node-based pointer chasing in standard library trees.
Instead of changing the data structure, the team optimized the algorithm. Frequent calls to std::vector::erase triggered costly memcpy operations ($O(N^2)$ complexity). By replacing immediate erasures with a two-pass approach using std::remove_if, and introducing SimpleMemoryArena::DeallocateAfter(int32_t node) to purge allocations in a single batch, deallocation complexity was successfully reduced to $O(N)$.
Finally, for allocation routines plagued by $O(N^2)$ scaling under the Greedy-by-Size framework, developers implemented periodic purging of inactive tensor records associated with already-executed nodes. This drastically reduced active dataset size ($N$), ensuring that memory arena overhead shrank from 49.9% down to a nominal 11%.
Supporting Data & Performance Metrics
The cumulative impact of these targeted refactorings transformed the runtime profile of dynamic TensorFlow Lite models. Below is a summary of the performance shifts observed across profiling cycles:

- Initial Memory Arena Overhead: 54.3% of total model runtime.
- Post-Phase 2 (Caching & Accessors): 25% reduction in total runtime; allocator overhead halved.
- Post-Phase 3 (Map Pre-calculation & Pointer Tracking):
CreateTensorAllocationVectordropped from 4.8% to 0.8%;ResolveTensorAllocationeliminated from profile. - Post-Phase 4 (Batch Deallocation & Record Purging): Total allocation and deallocation overhead plummeted from 49.9% to 11%.
- Final State (TensorFlow 2.13): Memory arena overhead reduced to 6%, restoring the Fully Connected layer and standard ML operators as the dominant consumers of compute cycles.
Official Responses and Engineering Philosophy
Speaking on the challenges of edge optimization, the TensorFlow engineering collective emphasized that code readability and theoretical algorithmic complexity can often blind developers to real-world hardware constraints.
"Operations on a set or a map have linear or logarithmic theoretical complexities, but they carry a heavy constant value overhead," noted Alan Kelly during the engineering review. "While textbook computer science favors trees and maps for dynamic insertions, modern hardware architecture heavily rewards the cache locality of contiguous memory blocks like
std::vector. Profiling on real devices with tools like Simpleperf forces us to confront these hardware realities rather than relying on intuition."
The decision to integrate these optimizations directly into the core runtime underlines Google’s ongoing commitment to democratizing high-performance machine learning. By ensuring that dynamic tensor resizing and variable-input models execute smoothly on low-end hardware, TensorFlow Lite bridges the gap between desktop-grade neural network training and constrained mobile deployment.
Implications for Edge AI Developers
The successful optimization of the TensorFlow Lite memory arena carries profound implications for the broader landscape of mobile and embedded machine learning:

- Democratization of Complex Architectures: Developers building applications with variable input shapes—such as real-time computer vision pipelines, natural language processing on-device, and speech recognition—no longer need to penalize their users with massive runtime bookkeeping latencies.
- The Indispensability of Hardware Profiling: The article serves as a cautionary tale for software architects: code that looks clean and efficient on a workstation can harbor severe bottlenecks on heterogeneous mobile system-on-chips (SoCs). Mastering tools like Simpleperf and
pprofis no longer optional for high-performance edge engineering. - Hardware-Aware Data Structures: The failure of
std::multimaphighlights that micro-optimizations must respect CPU cache hierarchies. Contiguous memory vectors, when paired with smart batch processing (std::remove_if), routinely outperform complex pointer-based containers in real-world scenarios. - Seamless Adoption: Because these optimizations are baked directly into TensorFlow 2.13 and higher, developers reap immediate performance rewards simply by updating their runtime dependencies, requiring zero source code rewrites for existing model implementations.
As edge devices continue to absorb more complex artificial intelligence workloads, the boundary between efficient software and specialized hardware will continue to blur. Through rigorous profiling and relentless optimization, TensorFlow Lite ensures that on-device machine learning remains as fast, lightweight, and responsive as the modern user demands.