Illuminating the "Black Box": Unlocking Machine Learning Transparency with dtreeviz
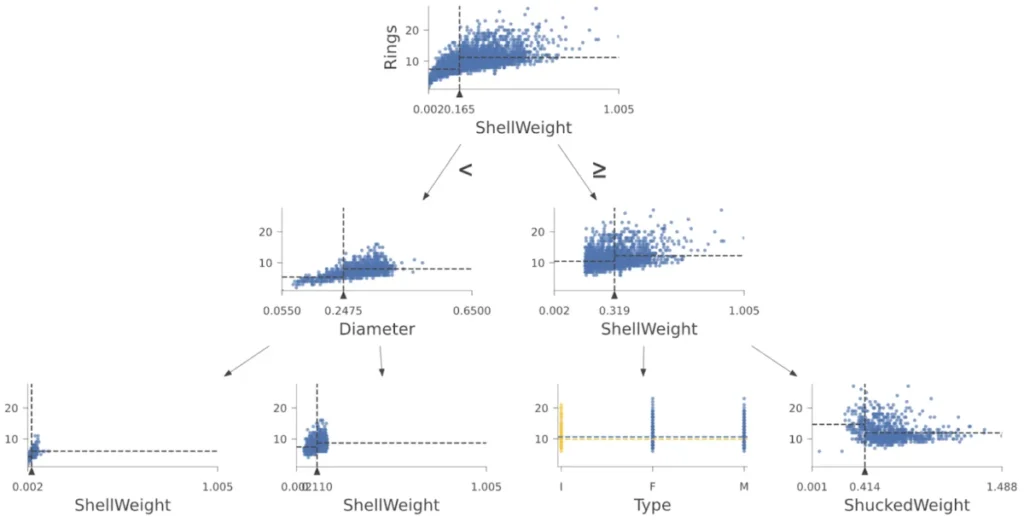
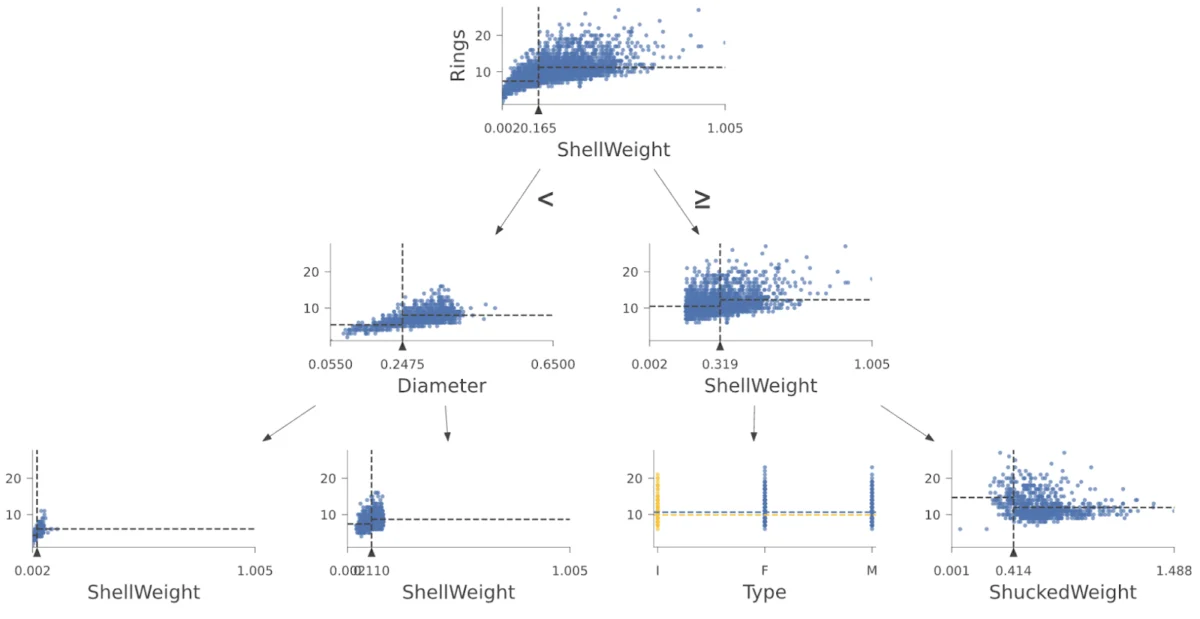
In the rapidly evolving landscape of artificial intelligence, Gradient Boosted Trees and Random Forests have cemented their status as the workhorses of machine learning. Particularly for tabular data—the format in which the vast majority of business and scientific information is stored—these models are unparalleled in accuracy and efficiency. However, their internal decision-making processes have historically been obscured behind layers of complex mathematics, often relegating them to the status of "black box" models.
A significant breakthrough in demystifying these systems has arrived through the integration of dtreeviz, a state-of-the-art visualization library that transforms abstract data paths into intuitive, human-readable maps. Recently, Google’s TensorFlow team underscored the importance of this development by releasing a comprehensive tutorial on using dtreeviz to interpret TensorFlow Decision Forest (TF-DF) models, signaling a shift toward more transparent and accountable AI.
The Evolution of Interpretability: A Chronological Overview
The journey toward visual model interpretability began in earnest as machine learning moved from academic research into high-stakes industries like finance, healthcare, and insurance.

- 2018: The Birth of dtreeviz. Recognizing the need for better diagnostic tools, researchers introduced dtreeviz as an open-source solution designed to render complex decision trees into clear, graphical representations. Unlike standard tree-plotting utilities that often produce cluttered, unreadable charts, dtreeviz was built with the human brain’s cognitive load in mind.
- 2020-2022: Industry Adoption. As the library gained traction, its community grew exponentially. Developers began utilizing the tool not just for debugging, but for "model auditing"—a crucial practice for ensuring that models aren’t relying on biased or nonsensical correlations within datasets.
- 2024: Integration with TensorFlow. The recent collaboration between the TensorFlow team and the creators of dtreeviz marks a maturation point. By providing an official tutorial, Google has essentially standardized the use of dtreeviz as a primary tool for interpreting decision forests within the TensorFlow ecosystem.
Deciphering the Decision: How Trees Think
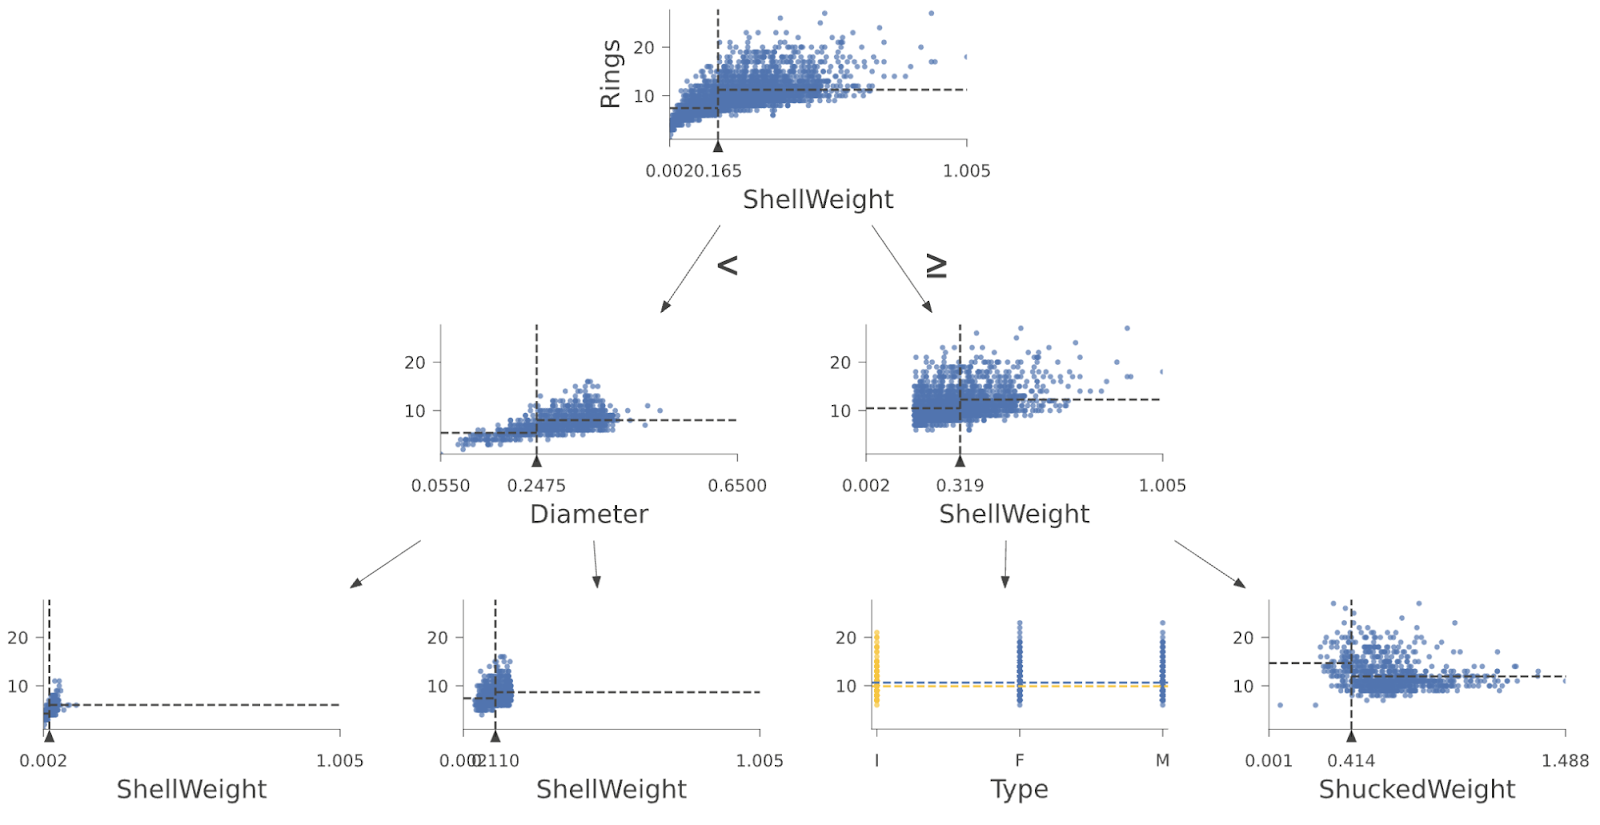
At their core, decision trees function as a series of logical sieves. During training, a model ingests raw data and performs a "condensing" operation, distilling vast amounts of information into a hierarchical structure of binary splits. Each "node" in this structure acts as a gatekeeper, testing a specific feature against a threshold learned during the training phase.
The Anatomy of a Prediction
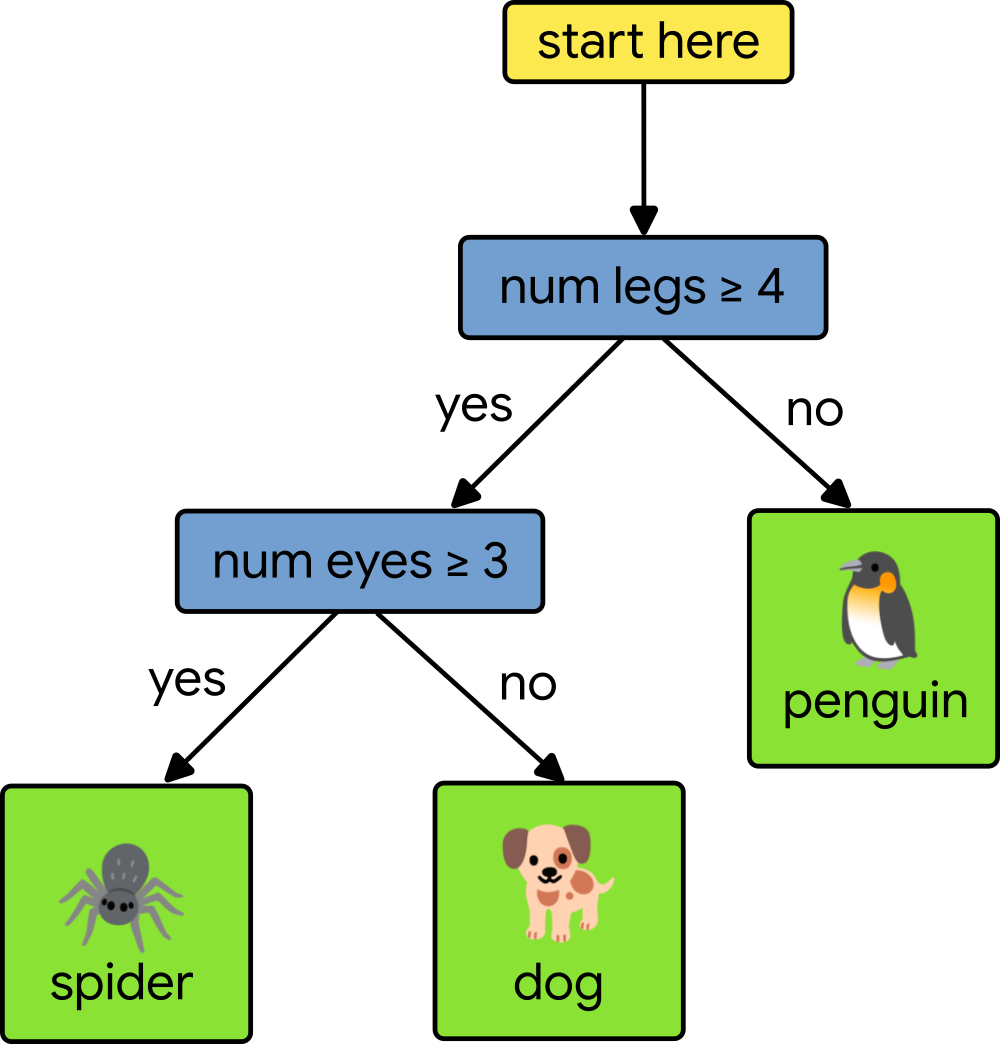
When a model makes a prediction—whether it is calculating the market price of a house (regression) or determining the likelihood of a medical diagnosis (classification)—it essentially traverses a path from the root node down to a final "leaf." Each step along this path is a binary decision: Is the feature value greater than X? If yes, go left; if no, go right.
To illustrate this, consider a simple model designed to classify animals. By comparing variables such as the number of legs and eyes, the tree narrows down possibilities. If an animal has four legs and two eyes, the model filters these inputs through its internal logic to arrive at a definitive classification: "Dog." While this is a trivial example, the exact same logic applies to complex, high-dimensional datasets used in enterprise-grade machine learning.

Supporting Data: Why Visualization is Non-Negotiable
The necessity for visualization is backed by the practical challenges of model performance. When a model fails, or when a user challenges a model’s prediction (such as a loan rejection), data scientists cannot simply point to a line of code. They must explain the why.
The Palmer Penguins Case Study
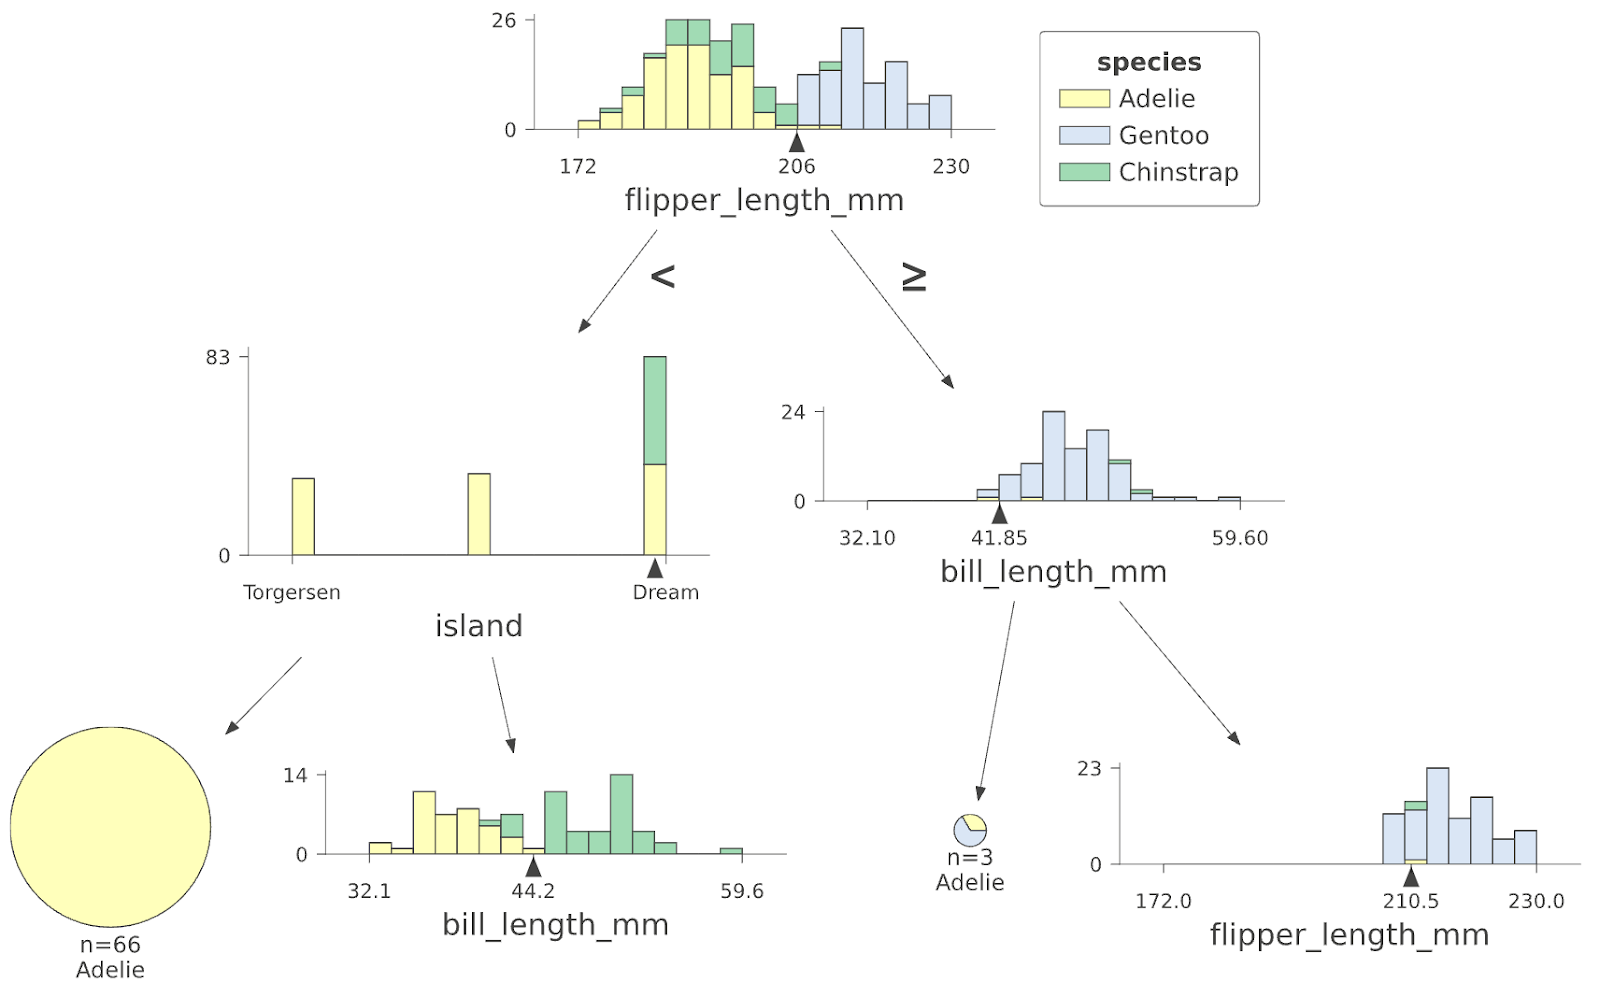
One of the most effective ways to visualize these decisions is through the Palmer Penguins dataset, a staple for machine learning demonstration. By using dtreeviz, researchers can project the internal state of a Random Forest onto a screen. For instance, the library allows for the visualization of:
- Feature Domain Splits: How the model carves up the numerical space of features like
flipper_length_mmorbill_length_mm. - Leaf Distributions: A critical component for understanding uncertainty. A leaf node doesn’t just hold a value; it holds a distribution of training instances. Visualizing this allows engineers to see if a prediction is based on a robust cluster of data or a sparse, potentially unreliable set of outliers.
Path Analysis
Perhaps the most powerful feature of dtreeviz is the ability to highlight the specific path taken by a single test instance. By seeing the path highlighted in a distinct color, such as orange, a user can instantly identify which features triggered a specific outcome. This is the cornerstone of "explainable AI" (XAI). If a loan application is rejected, the visual map points directly to the threshold that failed—perhaps a debt-to-income ratio that exceeded the model’s tolerance.
Official Perspectives and Technical Implementation
The TensorFlow team, including contributors like Terence Parr, emphasizes that visualization is not merely an optional step—it is a "fundamental building block" of model development.
For developers looking to integrate this, the barrier to entry is intentionally low. By wrapping the model in a dtreeviz instance, users can extract deep insights with minimal lines of code:
# Extracting features and labels
penguin_features = [f.name for f in cmodel.make_inspector().features()]
penguin_label = "species"

# Configuring the visualization
viz_cmodel = dtreeviz.model(cmodel,
                            tree_index=3,
                            X_train=train_ds_pd[penguin_features],
                            y_train=train_ds_pd[penguin_label],
                            feature_names=penguin_features,
                            target_name=penguin_label,
                            class_names=classes)

# Rendering the visualization
viz_cmodel.view()
This snippet, provided in the official documentation, highlights the library’s modularity. It allows for the inspection of specific trees within a forest (a "Random Forest" is actually an ensemble of many trees), providing a granular look at the forest’s internal diversity.
The Broader Implications for AI Ethics and Reliability
The rise of tools like dtreeviz has profound implications for the ethics of machine learning. As regulatory bodies like the European Union (with the AI Act) push for greater transparency, the ability to "open the hood" of a model becomes a legal and professional necessity.
Moving Beyond Accuracy
For years, the machine learning community focused almost exclusively on accuracy scores. However, high accuracy does not guarantee safety or fairness. A model might reach the correct conclusion for the wrong reasons—a phenomenon known as "shortcut learning." By visualizing the tree, developers can detect if a model is relying on spurious correlations (e.g., classifying a lung condition based on the brand of the X-ray machine rather than the lung tissue itself).
Toward Human-in-the-Loop AI
The future of AI is not purely automated; it is collaborative. Tools like dtreeviz facilitate a "human-in-the-loop" workflow where domain experts (such as doctors, credit officers, or engineers) can verify that the logic learned by the machine aligns with human expertise. When the model’s "reasoning" is displayed in a clear, graphical format, it fosters trust between the algorithm and the human decision-maker.
Conclusion: A New Standard for Clarity
As we move forward, the "black box" era of machine learning is coming to a close. The widespread adoption of visualization libraries like dtreeviz represents a fundamental shift in how we build and trust technology. By making the abstract logic of decision trees visible, we are not just improving our ability to debug code—we are enhancing our ability to govern, verify, and responsibly deploy the systems that increasingly define our world.
For those eager to dive deeper, the path forward is clear: start by reviewing the TensorFlow Decision Forest tutorial and begin visualizing your own models. In the world of data, seeing is truly believing—and in this case, seeing is also understanding.