Mastering the Arduino Serial Plotter: A Guide to Customizing Your Data Visualization
In the realm of embedded systems development, the ability to visualize real-time data is as critical as the code itself. For years, the Arduino IDE’s "Serial Plotter" has served as a staple utility for engineers, students, and hobbyists. It provides an immediate, low-overhead graphical representation of incoming serial data. However, as the Arduino IDE has evolved into the more sophisticated 2.0+ framework, a common point of friction has emerged: the rigid, pre-configured axis scaling.
While the Serial Plotter is powerful, it defaults to a restricted 50-point window on the X-axis and an auto-scaling dynamic Y-axis. For many users, this makes monitoring stable signals—like heartbeat monitors, sine waves, or sensor calibration—incredibly frustrating, as the view jumps or truncates unpredictably. This article explores how to overcome these limitations through clever code implementation and direct configuration modification, empowering you to take full control of your diagnostic environment.
The Core Challenge: Why Scaling Matters
Data visualization is not merely aesthetic; it is a fundamental diagnostic requirement. When debugging an analog signal, the context provided by the surrounding data points is essential for identifying noise, drift, or transients.
In Arduino IDE 2.0 and later, the Serial Plotter employs a "moving window" algorithm. The X-axis is fixed at a 50-point horizon, and the Y-axis is programmed to "auto-scale" based on the minimum and maximum values captured within that narrow window. While this is helpful for rapid, transient data, it fails when dealing with steady-state signals. If you are monitoring a clean 1Hz sine wave, the auto-scaling Y-axis will continuously adjust to the noise floor, causing the waveform to appear as if it is vibrating or expanding and contracting, rather than maintaining a constant amplitude. This visual instability can lead to incorrect conclusions during testing.
Illustrating the Problem
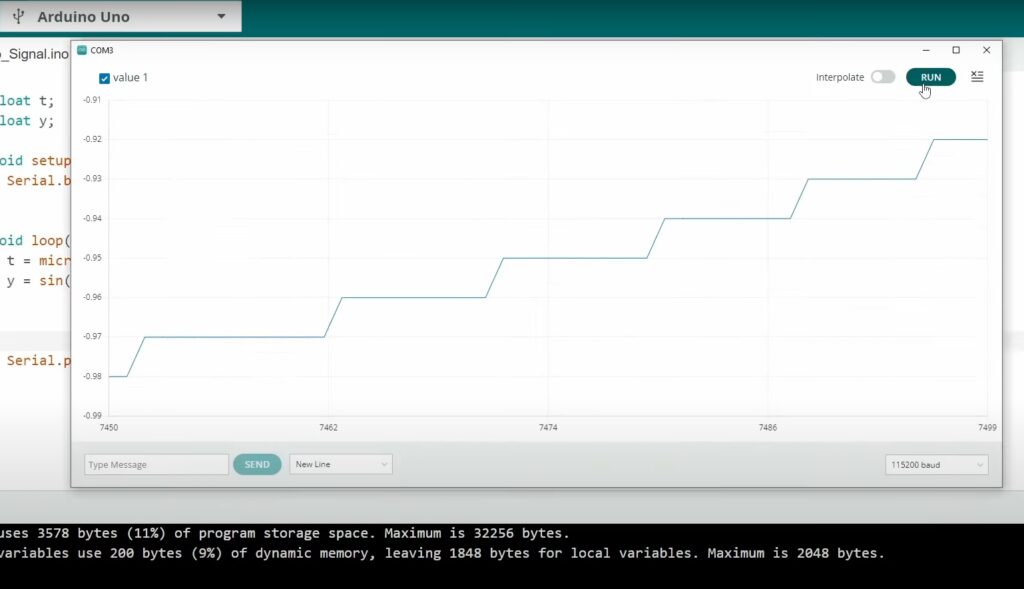
To visualize this frustration, consider a simple test script generating a basic sine wave. In the standard plotter, the lack of fixed bounds will cause the graph to stutter.
float t; float y;
void setup()  Serial.begin(115200);

void loop()
  t = micros() / 1.0e6;
  y = sin(2 * PI * t);
  Serial.println(y);
Running this code reveals the "auto-scale" issue in real-time. As the signal oscillates, the Y-axis range shifts, making it impossible to see the signal relative to a fixed reference point.
Stabilizing the Y-Axis: The "Invisible Boundary" Technique
Before resorting to modifying the IDE’s source files, one can manipulate the plotter’s behavior using the data stream itself. The Serial Plotter interprets every comma-separated value as a distinct series. By "tricking" the plotter into rendering invisible boundary lines, you can force the Y-axis to stay locked to a specific range.
The Implementation
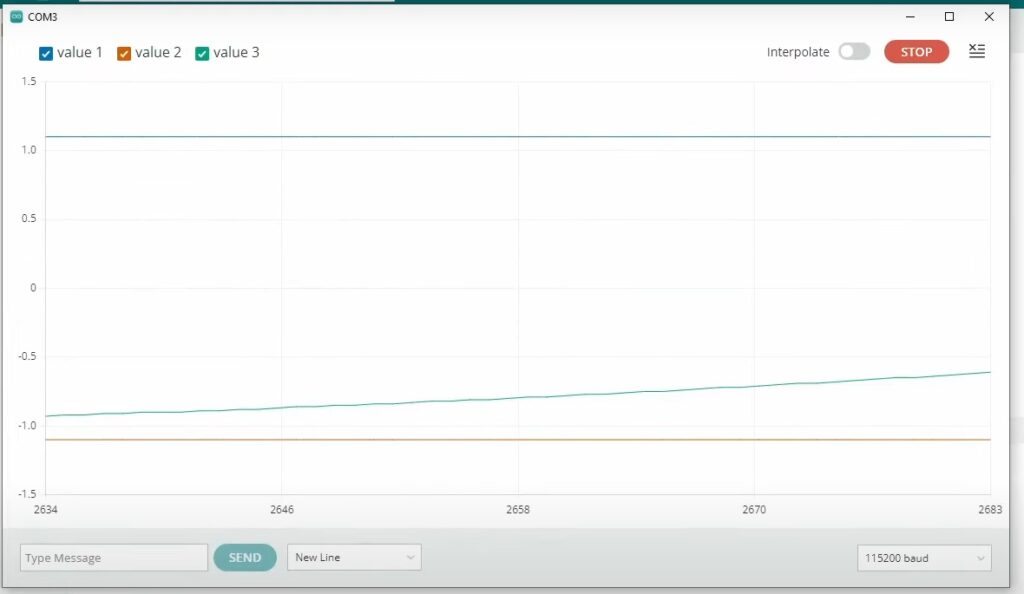
To force the Y-axis to maintain a range between -1.1 and 1.1, you can output these constant values alongside your actual data. The plotter will treat these as part of the dataset, effectively forcing the vertical axis to accommodate them.
float t; float y;
void setup()  Serial.begin(115200);

void loop()
  t = micros() / 1.0e6;
  y = sin(2 * PI * t);
  // Printing the boundaries as additional series
  Serial.print("1.1, ");
  Serial.print("-1.1, ");
  Serial.println(y);
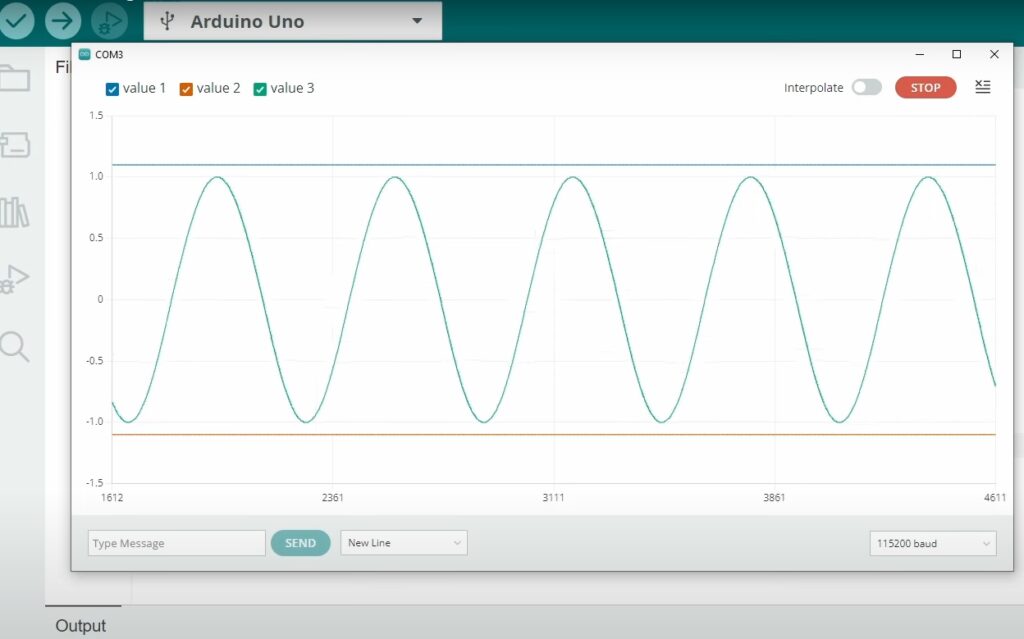
By adding these constants to your Serial.print statements, the plotter calculates its dynamic range to include these values, resulting in a perfectly stable Y-axis. This is a non-destructive method that requires no configuration changes and works across all versions of the IDE.
Expanding the Horizon: Modifying the X-Axis
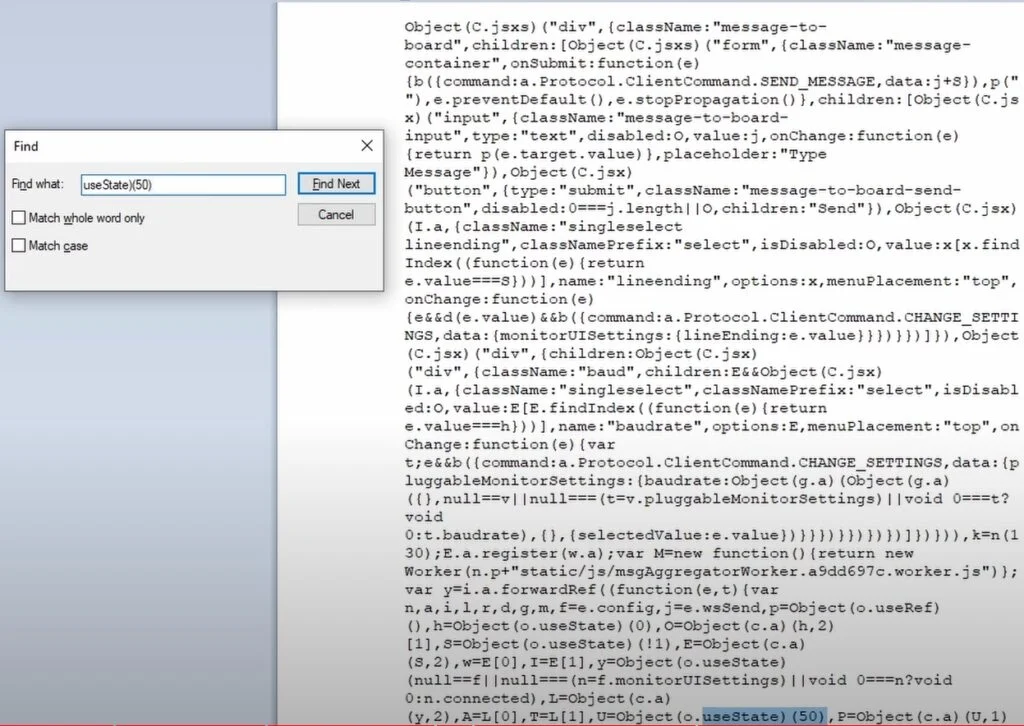
While the Y-axis can be managed through code, the X-axis is a hard-coded constraint within the Arduino IDE’s internal JavaScript-based interface. To expand the view beyond the default 50 points, you must interact with the IDE’s core resource files.
Step-by-Step Configuration Edit
Note: Before proceeding, ensure that your Arduino IDE is closed to prevent file corruption.
- Locate the JavaScript Bundle: Navigate to your Arduino IDE installation directory. On Windows, this is typically found within
C:Users[YourUsername]AppDataLocalArduino15packagesarduinotoolsarduino-ide...or within the application’s program files. Search for a file namedmain.35ae02cb.chunk.js. - Open the File: Use a code editor like VS Code or Notepad++. The file will appear as a dense, minified block of JavaScript.
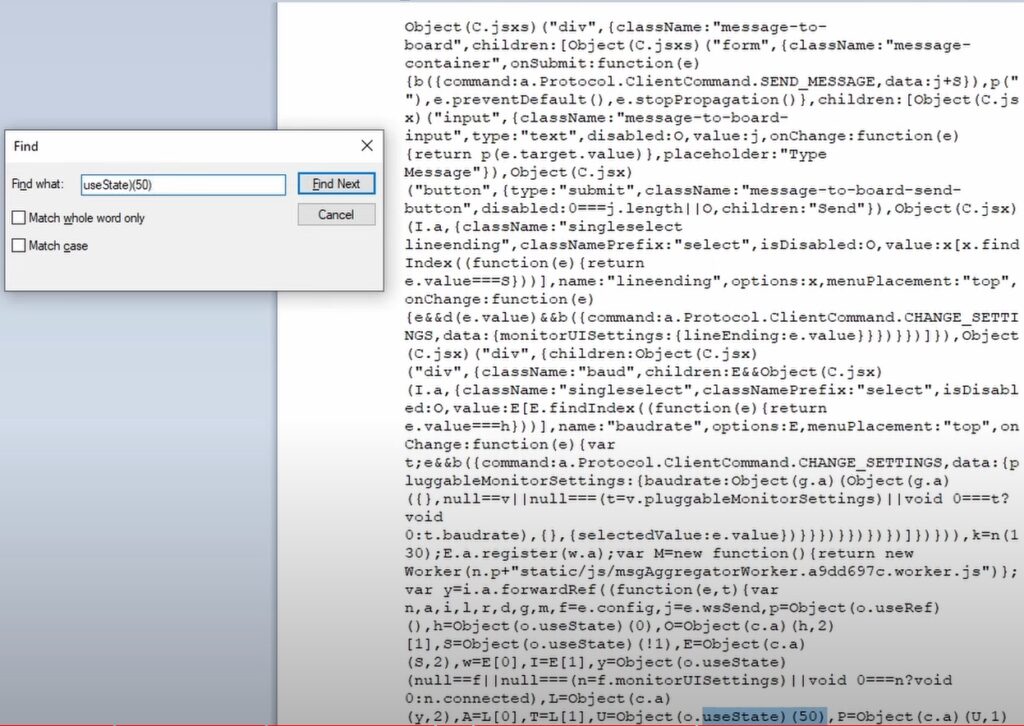
- Find the Variable: Use the search function (Ctrl+F) to look for the integer
50. You are looking for a sequence that defines the buffer size or data points count. In most versions, you will find a reference to50in the context of the plotter’s initialization. - Modify the Value: Change this value to your desired point count (e.g.,
500). - Save and Restart: Save the file and relaunch the Arduino IDE. Upon opening the Serial Plotter, you will notice the horizontal axis has expanded to reflect your new configuration.
Important Considerations and Risks
While this modification is effective, it is important to understand the technical implications. The Serial Plotter is a client-side visualization tool. By forcing it to render 500 or 1,000 points, you are increasing the memory overhead of the IDE’s rendering engine. If you set this value too high—for instance, to 5,000—the application may encounter a buffer overflow, leading to intermittent frame drops or the plotter stopping entirely. Always perform these edits on a copy of the original file, so you have a "clean" version to revert to if the IDE becomes unstable.
Implications for Advanced Data Analysis
The methods described here are essential for developers working with real-time sensors, such as accelerometers, thermistors, or pulse oximeters. When you are debugging a PID loop, seeing the historical response of the system is just as important as the current state.
However, as the complexity of your projects grows, the built-in Serial Plotter will eventually reach its functional ceiling. While these "hacks" provide a temporary reprieve, professional-grade projects often transition to more robust visualization frameworks.
The Professional Transition: Python and Beyond
If your project requires data logging, statistical analysis, or advanced multi-signal filtering, it is highly recommended to transition to external visualization tools. Python, specifically libraries like Matplotlib, PyQtGraph, or Dash, offers near-infinite flexibility. Using the pyserial library, you can capture Arduino data and route it into a high-performance GUI that allows for:
- Custom Time-Stamping: Recording data with millisecond-accurate timestamps.
- FFT Analysis: Running Fast Fourier Transforms on live signals to identify noise frequencies.
- Long-Term Storage: Saving high-fidelity data to CSV or SQL databases for post-process analysis.
Conclusion
The Arduino Serial Plotter remains one of the most accessible tools in the maker community. While the transition to the Arduino IDE 2.0 introduced rigid constraints on axis scaling, these limitations are not insurmountable. By utilizing the "invisible boundary" trick to stabilize the Y-axis and performing a targeted edit on the IDE’s JavaScript files to expand the X-axis, you can significantly enhance your diagnostic capabilities.
These techniques serve as a testament to the versatility of the Arduino ecosystem. Whether you are a student learning the basics of signal processing or an engineer validating a prototype, understanding the mechanics of your development tools is key to success. By mastering these configurations, you ensure that your hardware debugging is as precise as your code.
As always, when modifying system files, proceed with caution, maintain backups, and remember that as your projects scale in complexity, there is a world of professional-grade data analysis waiting for you beyond the limits of the IDE’s built-in features. Happy coding and happy plotting.