Mastering the Arduino Serial Plotter: A Professional Guide to Customizing Axis Scales
The Arduino IDE has long been the cornerstone of hobbyist and professional embedded development. Among its most powerful yet underutilized features is the Serial Plotter. Designed to provide real-time visual feedback for incoming serial data, it is an essential tool for debugging sensor readings, tuning PID controllers, and monitoring signal integrity. However, many engineers find themselves hitting a wall when they need to customize the visualization window.
The default behavior of the Serial Plotter in Arduino IDE 2.0 and later versions—which automatically constrains the X-axis to 50 data points and dynamically scales the Y-axis—can obscure long-term trends or make signal analysis erratic. While many developers pivot to external software like Python (Matplotlib) or Processing, these tools introduce unnecessary complexity for simple tasks. In this guide, we explore how to master the built-in Serial Plotter, stabilize your data, and unlock deeper insights without leaving the Arduino ecosystem.
The Challenge of Default Visualization
Main Facts: Why Scale Matters
In professional data acquisition, context is everything. If you are monitoring a sine wave with a frequency of 1Hz, but your plotter window only captures a fraction of a second due to the 50-point limit, you are not observing a wave; you are observing an incomplete, flickering segment of data.
The Serial Plotter’s dynamic Y-axis scaling, while helpful for quick checks, is the enemy of stability. If your signal fluctuates by even a small margin, the graph’s vertical bounds will jump, making it impossible to perform a visual comparison against a fixed reference point. Understanding how to manually govern these axes is not merely a "hack"—it is a fundamental skill for reliable hardware debugging.
Chronology of the Arduino IDE Interface
Since the migration to the VS Code-based architecture of Arduino IDE 2.0, the UI has become more modular. However, this modularity has obscured some of the configuration files that were previously easier to manage. Users have observed that the plotter’s constraints are hardcoded into the front-end JavaScript files that power the IDE’s interface. By tracing the execution path of the IDE, developers have discovered that the "50-point limit" is a default setting in the core rendering engine, which can be modified if one knows where to look.
Supporting Data: The Case for Manual Scaling
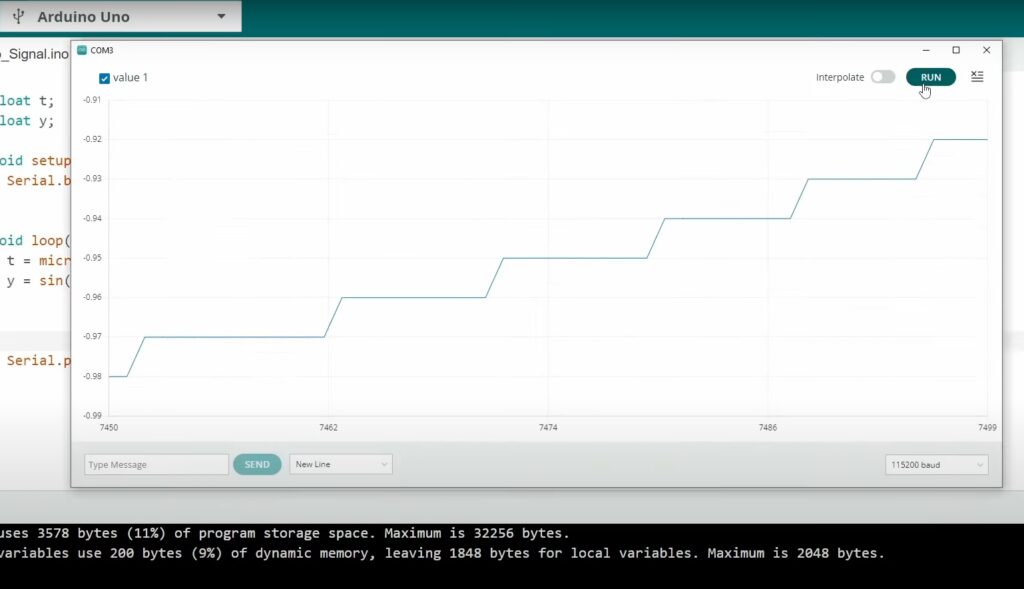
To demonstrate the limitations of the default settings, consider the following code snippet. This script generates a standard sine wave. If you run this in a default Arduino IDE installation, you will notice the Y-axis "breathing" and the X-axis rapidly scrolling, making it difficult to analyze the wave’s peak-to-peak consistency.
float t;
float y;

void setup()
  Serial.begin(115200);


void loop()
  t = micros() / 1.0e6;
  y = sin(2 * PI * t);
  Serial.println(y);
When you run this, the IDE calculates the range based on the last 50 samples. If your signal has noise, the "top" and "bottom" of your graph will shift continuously. To resolve this, we must force the plotter to acknowledge a fixed range.
Strategic Solutions: How to Take Control
1. Stabilizing the Y-Axis
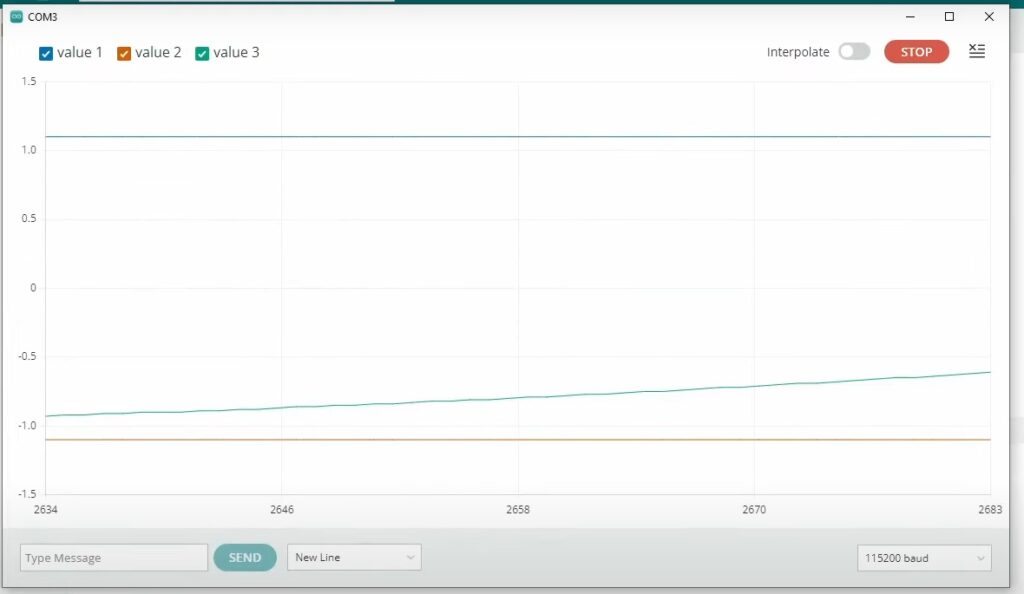
The most elegant way to force a stable Y-axis without modifying IDE source files is to "trick" the plotter. By sending dummy values that represent your desired maximum and minimum boundaries alongside your actual data, the plotter is forced to keep the view zoomed out to include those points.
Modified Implementation:
void loop()
  t = micros() / 1.0e6;
  y = sin(2 * PI * t);
  // Printing dummy values to force scale stability
  Serial.print("1.1, ");
  Serial.print("-1.1, ");
  Serial.println(y);
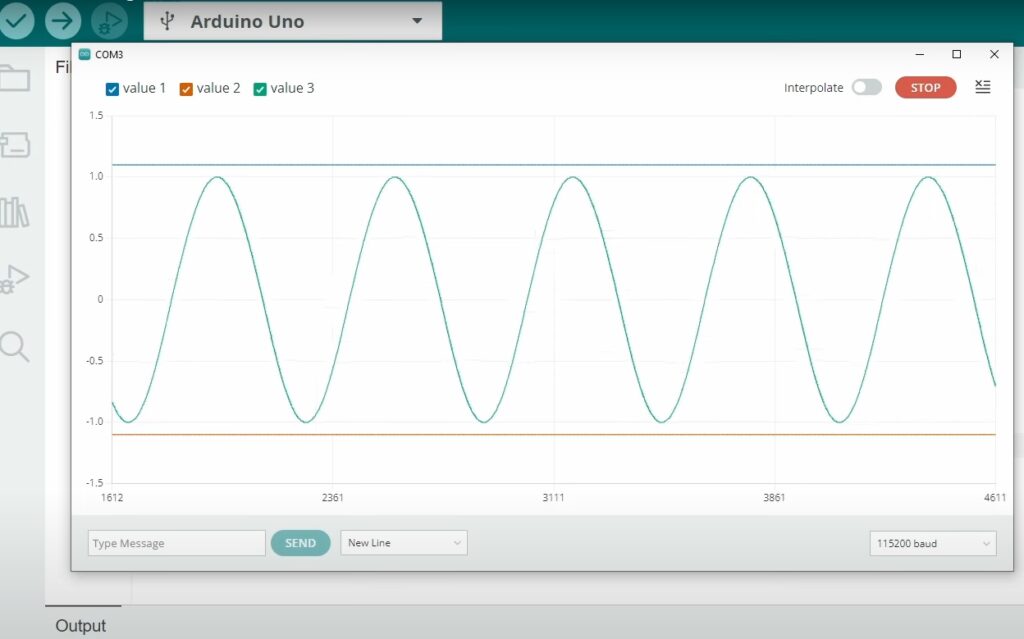
By printing 1.1 and -1.1 every loop, you create a static visual ceiling and floor. The plotter will now render the wave between these points, providing a stable, professional-grade view of your signal.
2. Extending the X-Axis: The "Deep Dive" Edit
While the Y-axis can be controlled via code, the X-axis limit is hardcoded into the IDE’s frontend. To change this, you must edit the internal JavaScript chunk file responsible for the plotter’s rendering logic.
A. Locating the Configuration File
The exact path depends on your OS:
- Windows:
C:Users<User>AppDataLocalArduino15packagesbuiltintoolsarduino-ide... - macOS:
/Applications/Arduino IDE.app/Contents/Resources/app/node_modules/...
You are looking for a file named main.35ae02cb.chunk.js (or similar, depending on your version update).
B. Executing the Edit
- Backup: Always create a copy of the file before editing.
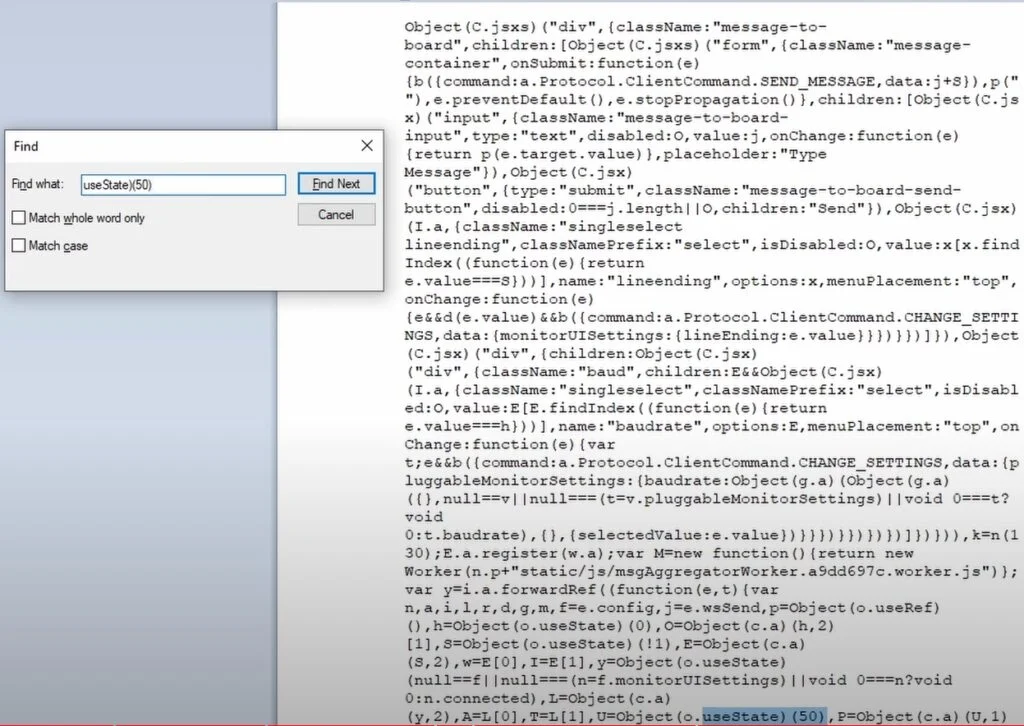
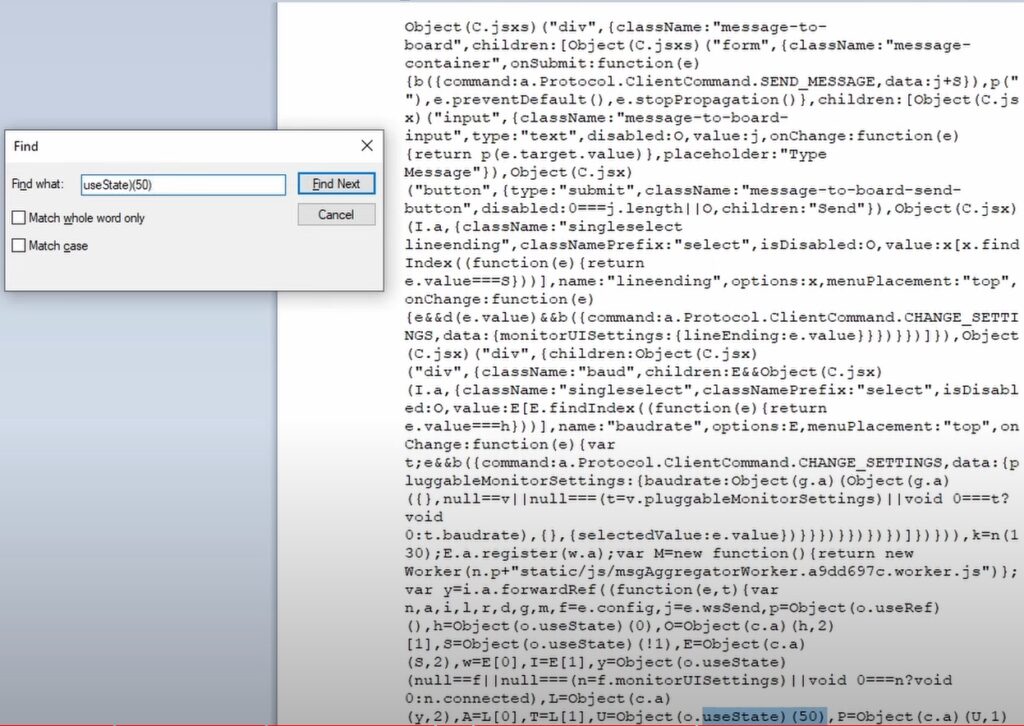
- Search: Open the file in a code editor like VS Code or Notepad++. Search for the value
50. - Identify the Constraint: Look for the section defining the
maxPointsorwindowSize. You will likely see a variable set to50. - Modify: Change this value to your desired limit (e.g.,
500or1000). - Save and Restart: Save the file and fully close/reopen the Arduino IDE.
Implications and Warnings: The "Data Overload" Threshold
It is important to understand the hardware and software implications of this modification. While extending the X-axis allows you to see more history, it consumes more RAM in your computer’s memory.
The Performance Limit:
If you set the X-axis to an extreme value, such as 5000 or 10,000 points, you may encounter several issues:
- UI Lag: The IDE’s rendering engine will begin to drop frames, resulting in a sluggish interface.
- Data Buffer Overflow: If the Serial buffer is flooded with data faster than the GUI can render it, you will notice gaps in your graph.
- Truncation: The plotter may arbitrarily stop rendering at a certain point if the memory allocation for that specific window is exceeded, often capping out between 3,000 and 4,000 points.
For professional-grade data logging, if you require a buffer larger than 2,000 points, it is highly recommended that you transition from the built-in plotter to a dedicated serial logging tool like SerialPlot or a custom Python/Matplotlib script. These tools offload the processing to more efficient libraries, ensuring that your long-term signal data remains accurate and jitter-free.
Official Perspective and Future Outlook
While the Arduino development team has prioritized simplicity in the IDE’s interface, the user community has been vocal about the need for a "Settings" menu within the Serial Plotter. Current development roadmaps suggest that modular visual settings—including axis scaling and color management—are high-priority feature requests.
Until these features are natively implemented via a GUI, the methods described above remain the industry standard for power users. They allow for a high degree of control without compromising the integrity of the IDE or requiring a heavy-duty installation of third-party monitoring software.
Conclusion
The Serial Plotter is far more capable than its default "out-of-the-box" experience suggests. By mastering the art of dummy-value scaling for the Y-axis and performing controlled edits on the IDE’s JavaScript core for the X-axis, you transform a basic debugging window into a robust telemetry tool.
Whether you are tuning a drone’s flight controller, monitoring industrial sensor arrays, or simply visualizing the output of a classroom experiment, these adjustments provide the clarity required for precision engineering. As you continue your work with Arduino, remember that understanding the tools behind the interface is just as important as the code you write for the microcontroller itself.
Happy coding, and may your signals always be clean.