Peering Into the Black Box: How dtreeviz is Revolutionizing Decision Tree Interpretability
In the modern era of data science, the demand for transparency in machine learning models has never been higher. As organizations increasingly rely on complex algorithms to drive everything from financial lending decisions to medical diagnoses, the "black box" nature of these models has become a significant hurdle. At the forefront of solving this dilemma for tabular data—the most common format in enterprise environments—is dtreeviz, a powerful visualization library that is transforming how practitioners interpret Gradient Boosted Trees and Random Forests.
Recently, Google’s TensorFlow team highlighted the critical role of this tool by releasing a comprehensive tutorial on integrating dtreeviz with TensorFlow Decision Forests. By providing a window into the logic of decision trees, dtreeviz allows data scientists to move beyond mere predictive accuracy and into the realm of true model accountability.
The Core Mechanics: Why Decision Trees Matter
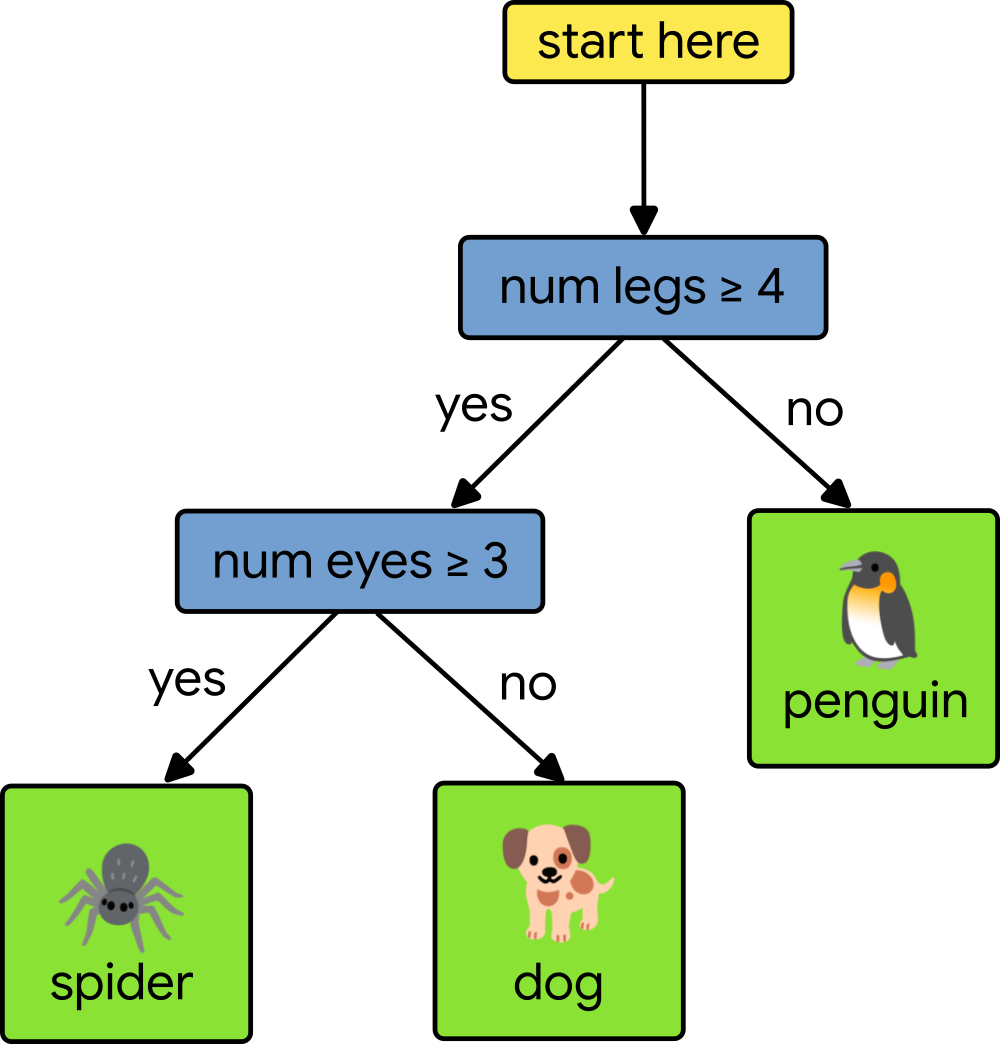
To understand the significance of dtreeviz, one must first appreciate the architecture of the decision tree. A decision tree is a hierarchical model that learns to partition data by identifying relationships between input observations and target values. It effectively acts as a flow chart of logic, where each internal node represents a specific decision based on a feature’s value, and each leaf node serves as the final prediction point.

For regression tasks, these leaves output a numerical value, such as a projected house price. For classification tasks, the model assigns a category, such as "benign" versus "malignant" tumor tissue. While the structure is conceptually simple, the reality of a complex ensemble model—where thousands of trees may be voting on an outcome—can be overwhelming. This is where the visualization capabilities of dtreeviz become indispensable.
A Chronology of Transparency
The trajectory of machine learning interpretability has shifted from opaque, complex neural networks toward more explainable models. The timeline of this evolution is marked by several key milestones:
- Pre-2018: Practitioners relied on rudimentary text-based tree dumps or low-resolution static plots that were often difficult to parse. Understanding the "why" behind a model’s prediction was a manual, error-prone task.
- 2018 (The Birth of dtreeviz): Recognizing the gap between model complexity and human interpretability, the dtreeviz library was introduced. It was designed to provide rich, visual representations of decision-making processes, quickly gaining traction as the industry standard.
- 2021–2023: The library saw rapid expansion, incorporating support for more sophisticated frameworks. It evolved from a niche tool into a widely adopted utility for data scientists seeking to debug models and validate their logic against real-world data distributions.
- 2024 (Integration with TensorFlow): The official endorsement and tutorial integration by the TensorFlow team marks a definitive shift, signaling that model interpretability is no longer an "optional" feature but a core component of the production machine learning lifecycle.
Supporting Data and Technical Implementation
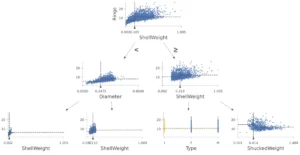
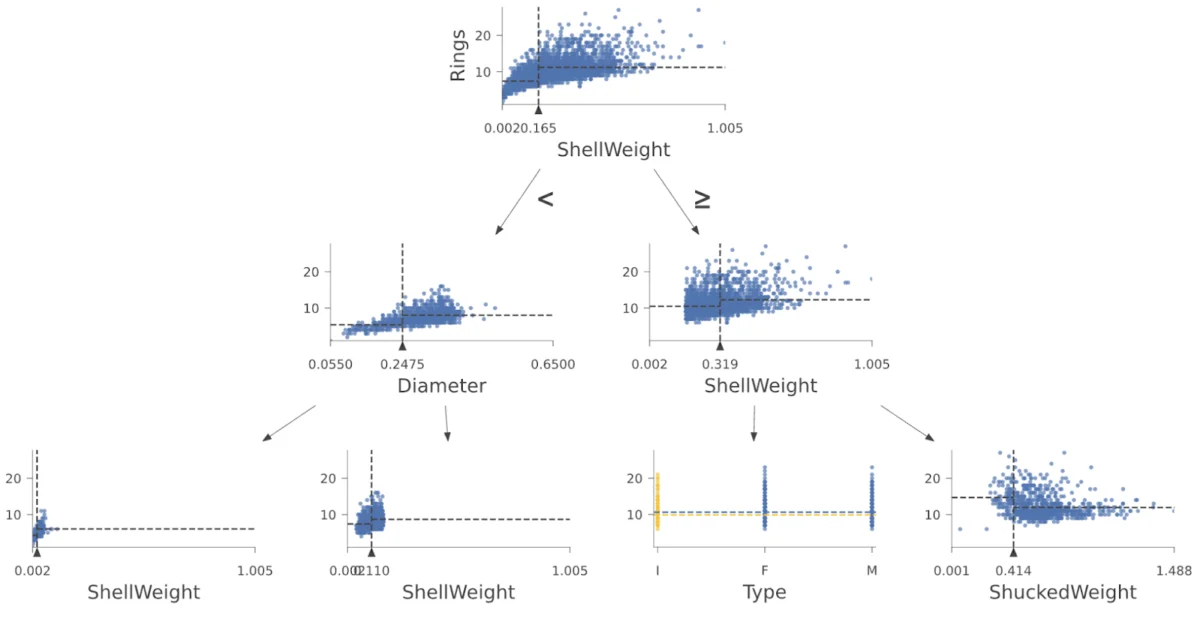
The power of dtreeviz lies in its ability to map the high-dimensional feature space into a legible, two-dimensional format. It does not merely draw lines; it illustrates the distribution of training instances within each leaf, providing context to the model’s confidence levels.

Visualizing the Logic
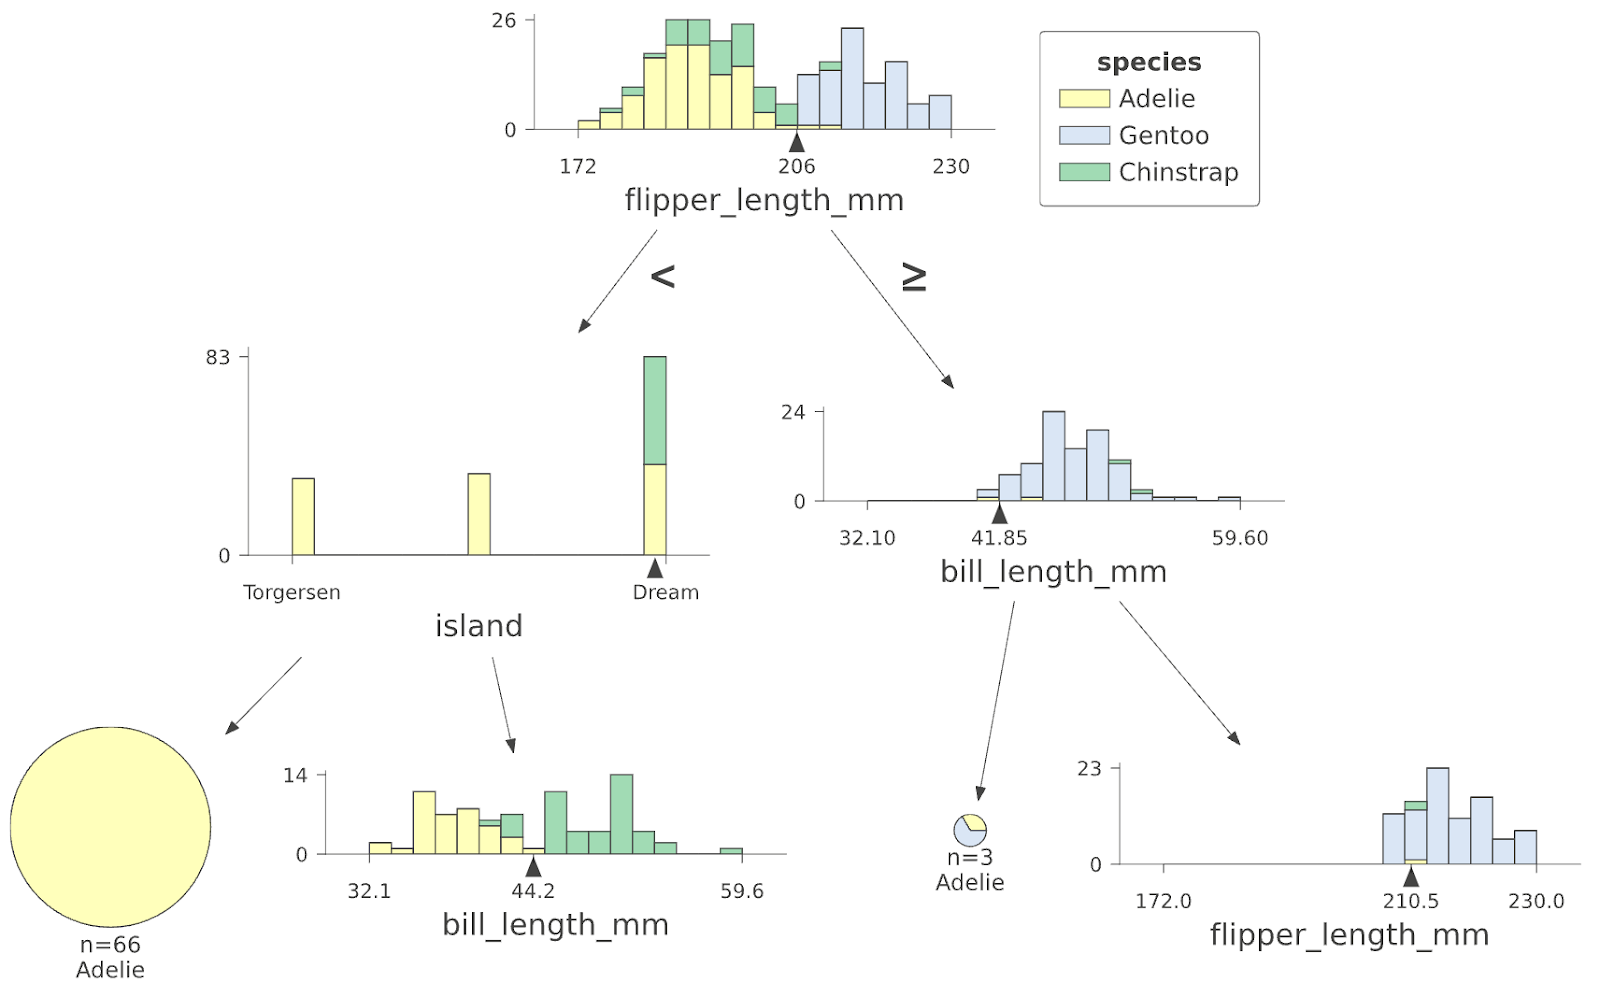
When a user feeds a model into dtreeviz, the library generates a graphical representation of the feature space partitions. For instance, in a Random Forest trained on the famous Palmer Penguins dataset, the library allows the user to see exactly how the model splits data based on flipper length or island type.
The implementation is remarkably concise. As demonstrated in recent tutorials, a data scientist can initialize the visualization with just a few lines of Python:
# Initializing the visualization for a classifier model
viz_cmodel = dtreeviz.model(cmodel,
                            tree_index=3,
                            X_train=train_ds_pd[penguin_features],
                            y_train=train_ds_pd[penguin_label],
                            feature_names=penguin_features,
                            target_name=penguin_label,
                            class_names=classes)
viz_cmodel.view()
This code snippet abstracts the complex underlying math, producing a high-fidelity visual that shows not only the split points but also the density of data points at every stage of the decision-making process.
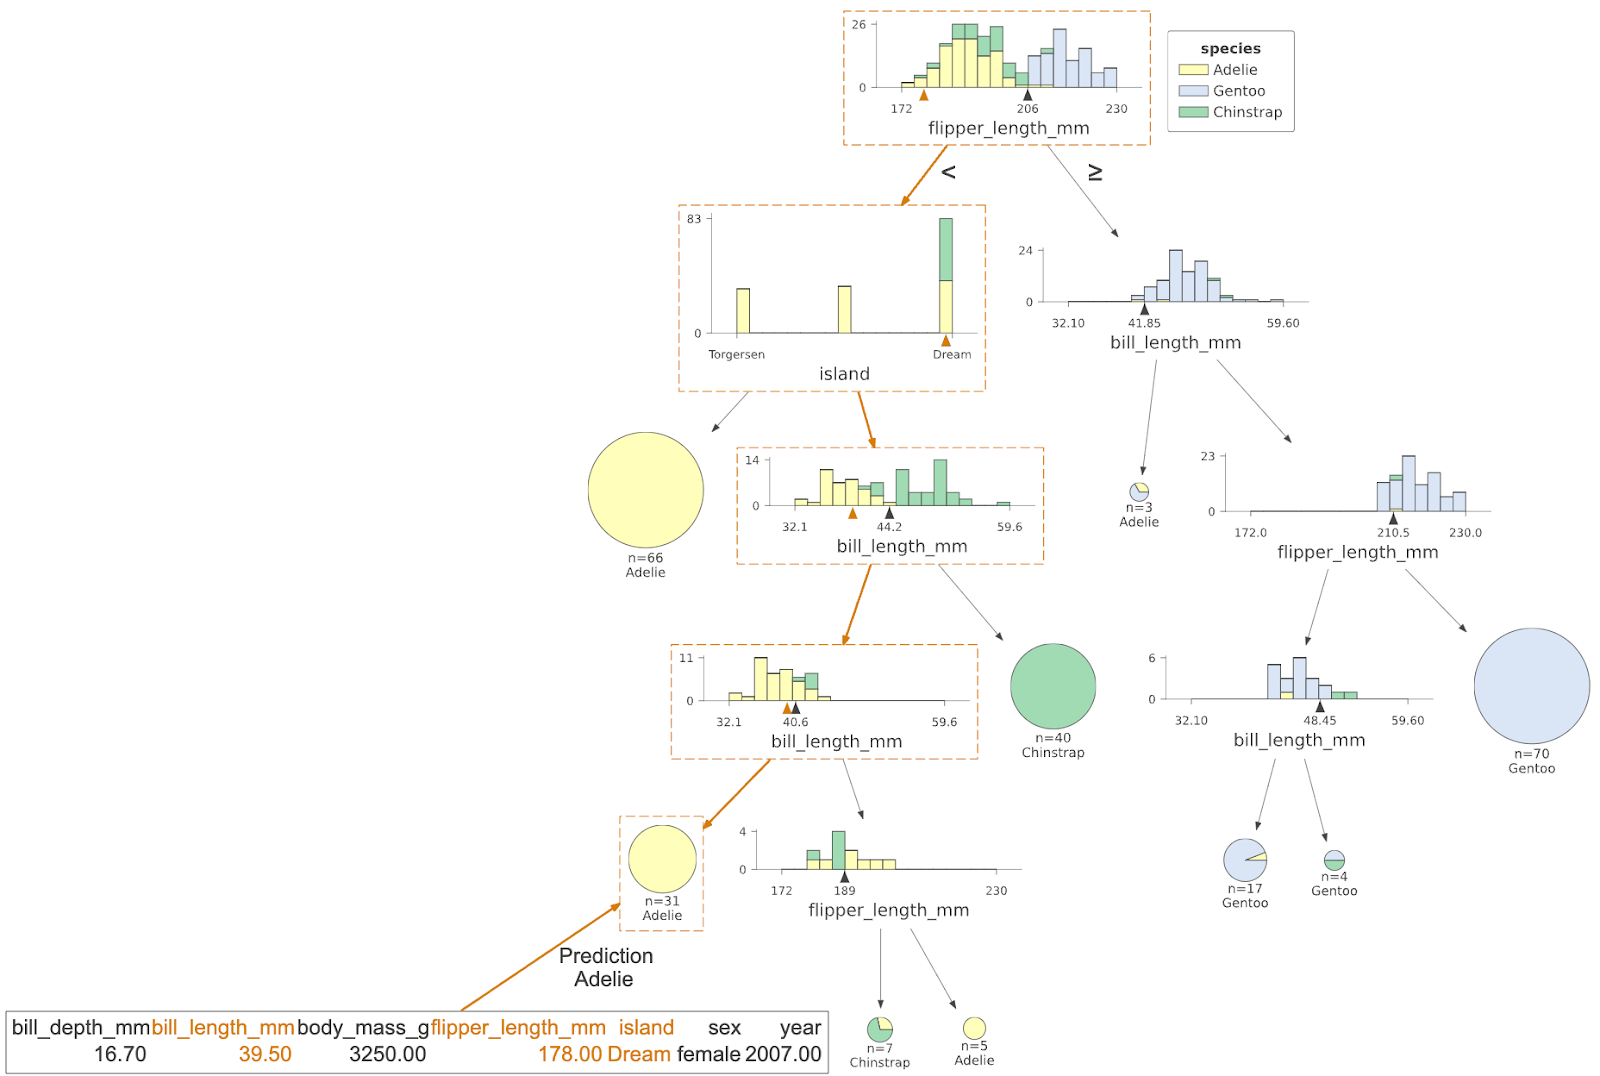
Tracing the Path of a Prediction
Perhaps the most potent feature of dtreeviz is its ability to highlight the specific "path" taken by a single test instance. By visualizing the traversal from the root node to the final leaf, developers can see which features were tested and where the specific input landed. This is crucial for auditing models for bias. If a loan application is rejected, an auditor can look at the path taken by the decision tree and immediately identify whether the rejection was driven by legitimate financial factors—such as debt-to-income ratio—or potentially sensitive, non-permissible features.
Official Perspectives: The Value of Explainable AI
The adoption of tools like dtreeviz by entities like Google underscores the industry’s commitment to "Explainable AI" (XAI). In official documentation and tutorial releases, experts argue that visualization is not just for debugging; it is for trust.
"Visualization is essential," says Terence Parr, a lead developer in this space. By seeing the internal splits of a decision tree, practitioners can verify that their model is learning logical, generalizable patterns rather than simply memorizing noise in the training set. When a model is interpretable, developers can identify overfitting—a common failure mode where a model performs well on training data but fails in the real world—by looking at leaves that contain only a single, anomalous data point.
Broader Implications for Industry
The implications of widespread dtreeviz adoption extend far beyond academic interest.
1. Regulatory Compliance
In industries like banking, healthcare, and insurance, regulations such as the GDPR (General Data Protection Regulation) increasingly require that automated decisions be explainable. If a system makes a decision that affects a human life, the entity behind that system must be able to explain the rationale. dtreeviz provides a visual audit trail that can be used to meet these regulatory burdens.
2. Debugging and Model Improvement
Data scientists often struggle with models that "should" work but don’t. Visualization allows them to identify feature engineering failures. For example, if a tree is splitting on an irrelevant feature, the visual representation makes that error glaringly obvious. This accelerates the iterative cycle of machine learning development, saving hundreds of hours of manual debugging.

3. Democratization of ML
By making complex models visually accessible, dtreeviz bridges the gap between data scientists and stakeholders. A business executive or a non-technical manager might not understand a Gini impurity score, but they can easily understand a flow chart that explains why a customer was flagged for churn. This facilitates better communication and decision-making within organizations.
Conclusion: Looking Ahead
The integration of dtreeviz into the standard data science workflow represents a maturation of the field. We are moving away from the "wild west" of black-box modeling and into a more disciplined, transparent, and auditable future.
As models grow in size and complexity, the need for these visual guardrails will only intensify. For those currently working with tabular data, adopting dtreeviz is not merely a recommendation—it is a best practice. Whether you are building a simple classifier to categorize animals or a complex forest to predict global economic trends, the ability to see, trace, and understand your model is the ultimate competitive advantage.
For those eager to dive deeper, the resources provided by the dtreeviz community, including the official TensorFlow tutorial and the design philosophy article, serve as the foundational map for navigating the complex, yet rewarding, terrain of machine learning interpretability. The black box is finally opening—and it’s time to see what’s inside.