Rethinking random_page_cost: Why PostgreSQL’s Most Controversial Setting Isn’t Just About Disk Speed
In the intricate world of PostgreSQL performance tuning, few parameters have sparked as much debate, experimentation, and outright frustration as random_page_cost. For decades, database administrators have viewed it as a simple lever to tell the query planner how expensive it is to fetch a page of data randomly versus sequentially. Yet, as storage technology has shifted from spinning mechanical platters to lightning-fast NVMe SSDs, the traditional wisdom surrounding this parameter has begun to crumble.
Tomas Vondra, a veteran database engineer, has recently revisited the topic, suggesting that random_page_cost is not merely a reflection of physical hardware performance—it is a "proxy" for a much deeper, more complex set of missing features in the PostgreSQL cost model.
The Chronology of a Misunderstood Parameter
The journey to understanding random_page_cost begins in the early 2000s. At the time, the default value was set to 4.0, a figure designed to account for the physical realities of PATA and early SCSI rotational drives, where the seek time—the physical movement of a disk arm—made random access significantly slower than sequential reads.
A few months ago, Vondra sparked a community-wide discussion by questioning whether this 4.0 default still held any relevance in an era where SSDs have largely rendered the "seek time penalty" obsolete. His initial inquiry, documented in a series of posts and culminating in a presentation at POSETTE 2026, aimed to determine if adjusting this cost would finally align the query planner with modern storage reality.
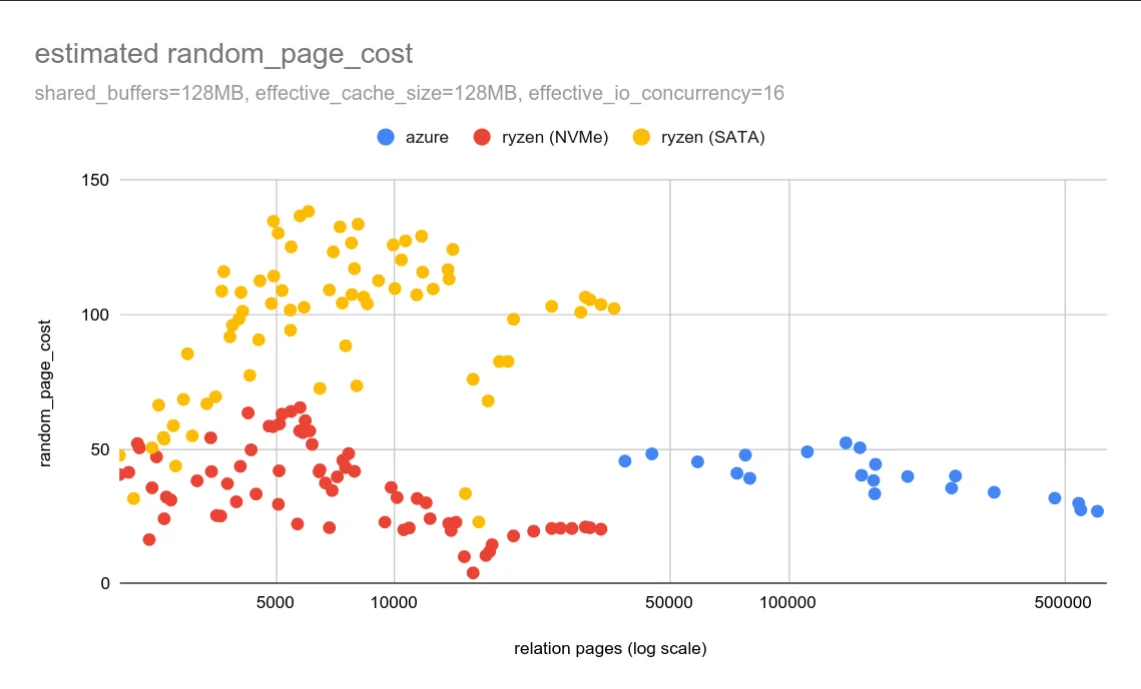
However, the results were startling. When Vondra performed benchmarks on older, rotational SATA drives, the actual measured random_page_cost was roughly 125—nearly 30 times higher than the PostgreSQL default. Conversely, on modern SSDs, the "real" cost was often just a fraction of the default. The data confirmed a long-standing suspicion: the 4.0 default was never a literal measurement of hardware latency, but rather a heuristic that happened to work "well enough" for two decades.
Supporting Data: When Theory Meets Reality
The disparity between hardware benchmarks and the PostgreSQL cost model is best illustrated by the performance of legacy rotational media. Even when using hardware that ostensibly matches the profile of the early 2000s, the "raw" I/O cost does not map to the database’s internal tuning values.
The data indicates that there is a fundamental disconnect. If the 4.0 default was supposed to represent the raw cost of random I/O, it has failed to do so for years. Instead, as storage speeds increased, the industry moved toward lowering random_page_cost (often to 1.1 or 1.0) to encourage the planner to prefer index scans over sequential scans. But why does this work? And more importantly, why does increasing this cost—which should theoretically make the planner more "accurate" regarding the high cost of random I/O—often result in catastrophic performance degradation?
The answer lies in the limitations of the PostgreSQL cost model itself.
The Invisible Variables: Where the Cost Model Fails
A cost model is, by definition, an approximation. As Vondra points out, it is impossible to create a model that captures every micro-interaction within a database system without becoming as complex as the database engine itself. In its current iteration, the PostgreSQL planner largely ignores two critical resources: memory state and access locality.
The Memory Blind Spot
PostgreSQL tracks work_mem as a hard limit for sorting and hashing operations, but the cost model remains largely oblivious to how memory is consumed at a page level. Consider a 100GB table where only 1GB of data is actually relevant to a query.
- The Sequential Scan Approach: A full sequential scan reads the entire 100GB. Even if the data is filtered, the act of reading that much data evicts 100GB of "active" data from the cache.
- The Index Scan Approach: An index scan might touch only the 1GB of relevant data. While individual random I/O operations are physically "slower" per page, the impact on the system’s memory cache is significantly lower.
The current cost model sees these two operations and focuses purely on the disk I/O cost, ignoring the "memory pressure" exerted by the scan. Because it doesn’t account for the fact that a sequential scan might evict a massive amount of cached data, it frequently favors sequential scans in situations where an index scan would have been much "cheaper" for the system’s overall memory health.
The Myth of the "Cold" Database
The planner operates under the assumption that every query starts with "cold" data—as if the system has no existing knowledge or cache. It fails to account for the "active set" of the database.
In most production environments, users are not querying a random 1TB of data; they are querying a small, localized "hot" set. Queries that rely on random I/O (like index scans) are often inherently more localized. They stick to the "hot" data. Sequential scans, by contrast, are "global" operations that effectively flush the cache. By setting a lower random_page_cost, administrators are essentially forcing the planner to prefer the more "localized" plan, effectively acting as a manual override for the planner’s lack of awareness regarding cache locality.
Official Responses and Community Feedback
The feedback from the database community has been consistent: whenever administrators attempt to tune random_page_cost to reflect the "actual" physical speed of their NVMe drives, performance rarely improves and often worsens.
This feedback loop has solidified the perspective that random_page_cost is a "fudge factor." It is a parameter that compensates for the fact that the planner does not understand concurrency, does not understand cache contention, and does not understand the long-term memory implications of its execution plans. The "right" value is not a technical measurement of your disk’s IOPS; it is a behavioral preference for how you want the database to treat your cache.
Implications for the Future of Database Tuning
What does this mean for the future of PostgreSQL? For one, it suggests that the search for a "perfect, automated tuning tool" for random_page_cost is likely a fool’s errand. Because the parameter is masking structural gaps in the cost model—specifically regarding memory and concurrency—no amount of disk profiling will yield the correct value.
The "Localized" Strategy
Vondra’s conclusion is that random_page_cost should be treated as a proxy for controlling plan behavior. Lowering the cost pushes the planner toward index-heavy, localized execution. This is generally a winning strategy for high-concurrency, high-memory-pressure systems where keeping the "active set" in RAM is the primary performance objective.
Practical Steps for Administrators
For those currently managing high-scale PostgreSQL deployments, the advice is clear:
- Stop treating
random_page_costas a hardware spec. It is not a latency metric for your SSD. - Use
pg_stat_statementsas your compass. Look at your most expensive queries. Are they doing massive sequential scans that destroy your cache? If so, consider loweringrandom_page_costto see if the planner switches to more index-friendly plans. - Monitor, adjust, and iterate. Because this is a system-wide setting, changing it can have unforeseen consequences for other queries. It is a balancing act that requires constant monitoring of the database’s actual workload rather than a one-time configuration based on hardware benchmarks.
In summary, the complexity of modern database performance requires us to look beyond the hardware. While the industry continues to push for faster drives, the most effective tuning often involves correcting the "math" of the query planner through the careful application of proxy parameters like random_page_cost. It is a reminder that in the world of software, the most accurate model is not always the one that reflects reality—it is the one that best helps the engine navigate its own limitations.