Unlocking Efficiency: How TensorFlow Lite Optimized its Memory Arena for Edge AI
In the rapidly evolving landscape of mobile machine learning, the efficiency of the runtime environment is just as critical as the accuracy of the neural network model itself. For developers deploying AI on resource-constrained edge devices, every millisecond of latency and every kilobyte of RAM matters. Recently, the TensorFlow Lite (TFLite) team undertook a rigorous performance engineering initiative to overhaul the memory arena initialization process. By leveraging advanced profiling tools, the team successfully reduced the runtime overhead of memory management, ensuring that TFLite remains the gold standard for high-performance, low-footprint on-device inference.
The Challenge of On-Device Inference
TensorFlow Lite is widely recognized for its ability to run complex machine learning models on devices with limited computational power and battery life. A key architectural pillar of TFLite is the "memory arena," a mechanism that minimizes memory usage by dynamically sharing buffers between tensors. By reusing memory across different layers of a model, TFLite significantly reduces the peak memory footprint, allowing larger models to run on smaller edge devices.

However, as model complexity grows and developers push for faster inference speeds, the administrative cost of managing this memory—specifically the initialization and allocation phases—can become a bottleneck. While ML engineers often assume that the heavy lifting in a model occurs within the convolution or fully connected layers, the TFLite engineering team discovered that in certain dynamic architectures, the runtime infrastructure itself was consuming a disproportionate amount of CPU time.
Chronology of the Optimization Effort
The optimization journey began with a realization that standard performance benchmarks were masking specific inefficiencies within the memory arena. To gain a granular view of execution, the team turned to Simpleperf, a powerful profiling tool native to the Android NDK (Native Development Kit).

Phase 1: Identifying the Bottleneck
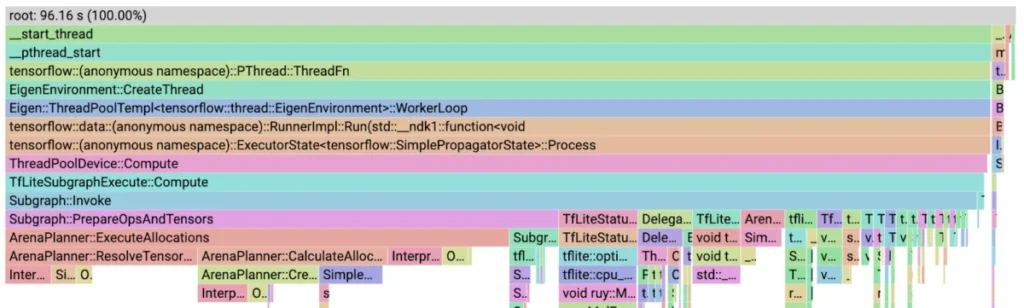
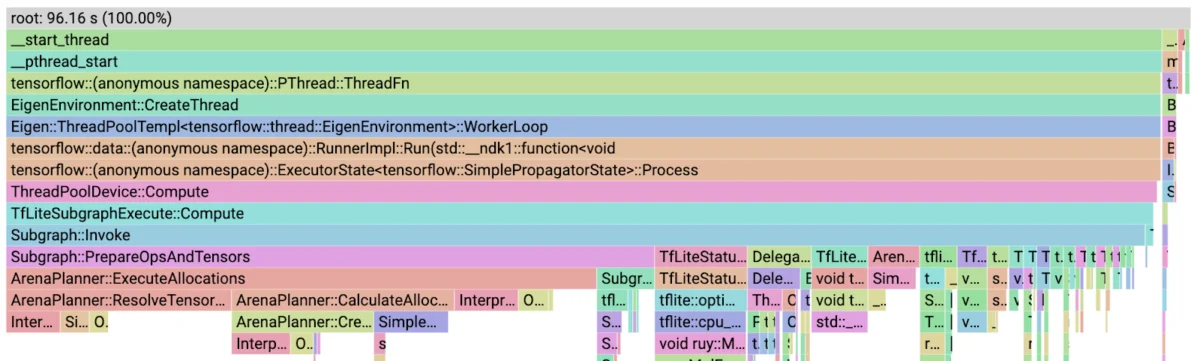
The team initiated the project by profiling a complex model characterized by variable input sizes and numerous dynamic tensors. In these scenarios, the output size of tensors is not known until the moment of operator evaluation, necessitating frequent re-allocations. Profiling revealed a startling statistic: ArenaPlanner::ExecuteAllocations accounted for over 54% of the total runtime.
Phase 2: Targeted Refactoring
The team broke the optimization process into iterative sprints, focusing on low-hanging fruit before tackling complex architectural shifts:

- Caching Tensor Counts: The team identified that
InterpreterInfo::num_tensors()was being called repeatedly within a loop. Because this was a virtual function, the overhead of constant invocation was significant. By caching the result of thenum_tensors()call outside the loop, the team eliminated unnecessary repeated logic. - Streamlining Tensor Access: Similarly,
InterpreterInfo::tensor(unsigned long)—a function responsible for bounds checking and pointer retrieval—was identified as a point of contention. The team introduced a more direct array-access pattern, bypassing the redundant overhead of virtual function calls for every individual tensor access. - Optimizing Allocation Logic: The team refactored
ArenaPlanner::CreateTensorAllocationVector, which handles the greedy-by-size allocation algorithm. By shifting from a per-node check to a pre-computed map of tensor allocations, the cost of this function was slashed from 4.8% to 0.8% of total runtime.
Phase 3: Finalizing the Arena
With the lower-level overheads addressed, the team turned to the core memory arena operations: Allocate and Deallocate. After testing various data structures, including std::multimap and linked lists, they determined that the existing std::vector approach was actually more performant due to better cache locality, despite the theoretical complexity advantages of other structures. However, they drastically improved the efficiency of the Deallocate process by replacing individual deletions with a bulk, deferred removal pattern using std::remove_if.
Supporting Data and Technical Methodology
The efficacy of these changes was verified through rigorous profiling. By visualizing the results using pprof, the team generated flame graphs that provided a clear visual representation of where the CPU was spending its cycles.

The Toolchain
To replicate these findings, developers can follow the methodology employed by the TFLite team:
- Simpleperf Integration: Using
run_simpleperf_on_device.py, the team pushed the target binary to the device and captured execution data in aperf.datafile. - Binary Caching: The
binary_cache_builder.pyscript was utilized to map binary symbols correctly, which is essential for accurate profiling. - Visualization: The generation of a
profile.protofile allowed for in-depth analysis viapprof, enabling the team to inspect call graphs, disassembly, and annotated source code.
The results were transformative. Following the initial optimizations, the runtime of the target model decreased by 25%, with the memory allocator’s overhead cut by half. Subsequent refinements to the deallocation logic ensured that ResetAllocationsAfter was virtually eliminated from the profile. By the end of the project, the time spent in the memory arena fell from nearly 50% of the total runtime to just 6%, effectively shifting the bottleneck back to the neural network operations where it belongs.

Official Responses and Engineering Philosophy
Alan Kelly, the lead software engineer on this project, emphasized that this work underscores the importance of "profile-guided development." In his documentation of the process, Kelly noted, "I was expecting to find that ML operators such as fully connected layers or convolutions would be the bottleneck… but runtime overhead can be a silent killer."
The official stance from the TensorFlow team is that performance is not a "set-it-and-forget-it" feature. By making the optimized memory arena available in TensorFlow 2.13, the team has provided a blueprint for how developers can utilize standard Android NDK tools to diagnose and resolve performance regressions in their own on-device pipelines. The project serves as a reminder that even in highly optimized frameworks, there is always room for efficiency gains when the code is subjected to systematic, data-driven scrutiny.

Implications for the Future of Edge AI
The implications of these optimizations are twofold. First, for end-users, this means faster, more responsive AI applications on mobile devices. Features like real-time image segmentation, voice recognition, and predictive text will feel snappier, as more of the device’s CPU cycles are dedicated to actual inference rather than memory management.
Second, for the broader developer community, this initiative validates the efficacy of existing tools like Simpleperf and pprof. By demonstrating that high-level, complex memory issues can be diagnosed and fixed with relatively simple code changes—such as caching values or replacing inefficient search patterns—the TFLite team has empowered developers to take a more proactive role in their own performance tuning.

As we move toward a future where AI is increasingly ubiquitous on the edge—ranging from wearables to industrial IoT sensors—the ability to squeeze every ounce of performance out of the hardware becomes a competitive necessity. The TFLite memory arena optimization project is not just a success story for one framework; it is a vital case study in the power of granular profiling and the relentless pursuit of software efficiency. With these improvements now integrated into the mainline TensorFlow codebase, the barrier to entry for high-performance edge machine learning has been lowered once again.