Illuminating the Black Box: How dtreeviz is Revolutionizing Decision Tree Interpretability
In the modern era of machine learning, the power of models often comes at the cost of transparency. While complex architectures like deep neural networks dominate the headlines, the backbone of enterprise-grade predictive analytics remains firmly rooted in tabular data. At the center of this landscape are Gradient Boosted Trees and Random Forests—two of the most widely deployed and robust machine learning paradigms in existence. Yet, despite their ubiquity, these models are frequently treated as "black boxes."
To bridge the gap between predictive performance and human understanding, Google and the open-source community have embraced a sophisticated solution: dtreeviz. This state-of-the-art visualization library has recently taken center stage following a new tutorial published by TensorFlow, marking a pivotal moment in how data scientists interpret the logic governing their decision forests.
The Core Fundamentals: Why Visualization Matters
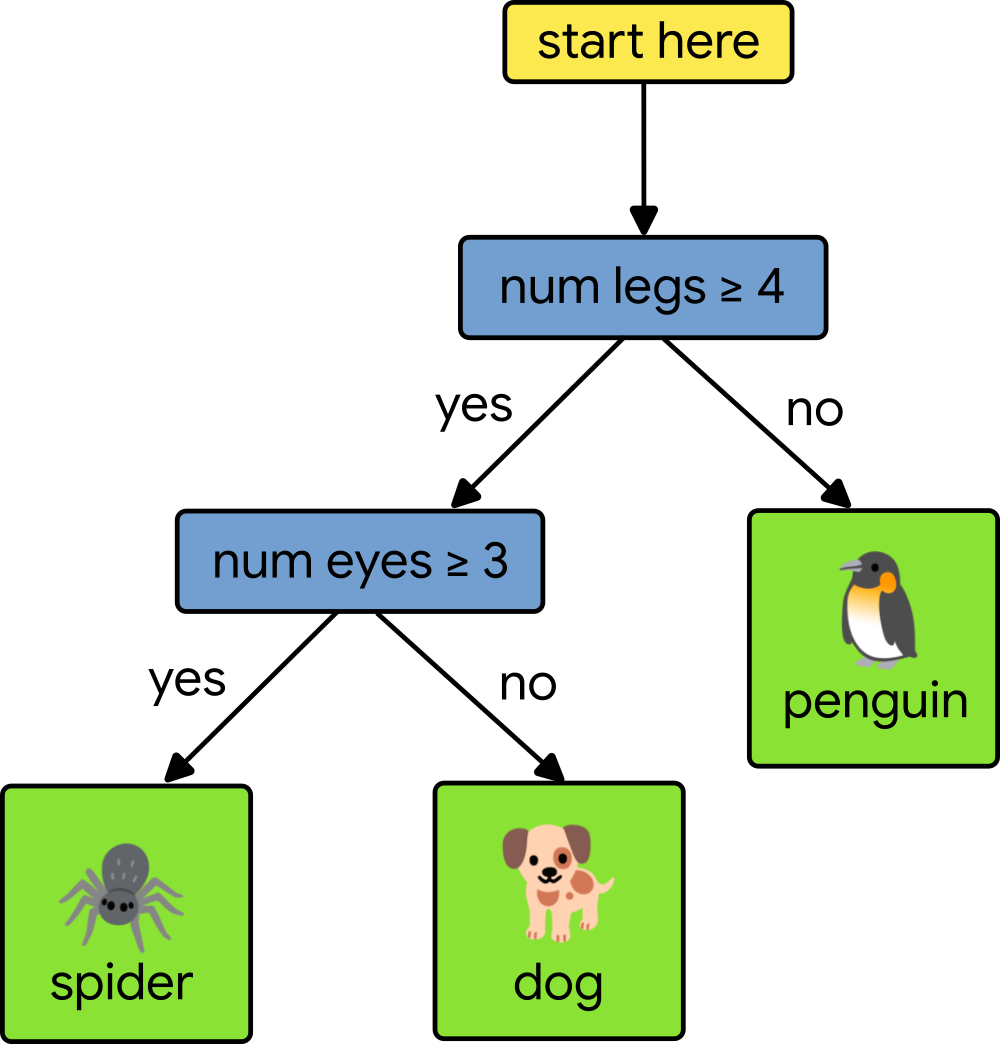
At its most basic, a decision tree is a hierarchical structure that mirrors human logic. It distills complex relationships within a dataset into a binary sequence of decisions. By partitioning training data into increasingly refined subsets, the tree maps observations to specific outcomes—predicting a continuous value for regression models or a discrete category for classifiers.

However, as these trees grow in depth to capture intricate patterns, they quickly become impossible for humans to audit manually. A model might reach a high-accuracy prediction, but why it arrived there remains obscure. This is where dtreeviz—a library originally released in 2018—has cemented its status as the industry standard for model interpretability. By transforming abstract mathematical split points into intuitive, graphical representations, dtreeviz allows practitioners to see the "why" behind the "what."
A Chronology of Progress: From 2018 to TensorFlow Integration
The journey of dtreeviz is a testament to the power of open-source collaboration. Since its inception in 2018, the library has undergone constant iteration. Terence Parr, the primary architect behind the project, has focused on creating a tool that is not merely decorative, but deeply diagnostic.
- 2018: Initial release of dtreeviz, providing a specialized way to visualize Scikit-Learn decision trees.
- 2020–2022: Rapid adoption within the data science community, with the library expanding to handle diverse forest structures and complex ensemble models.
- 2024: A significant milestone is reached as TensorFlow officially integrates dtreeviz into its ecosystem. The publication of a dedicated TensorFlow Decision Forests tutorial signals a strategic shift: Google is prioritizing the interpretability of its tree-based models as a primary feature for enterprise developers.
This evolution has been supported by a thriving community. Developers now have access to a repository of knowledge on platforms like StackOverflow, as well as high-quality educational resources, including the foundational article The Design of dtreeviz, which details the theory behind the library’s visual choices.

Supporting Data: The Mechanics of Interpretation
To understand the utility of dtreeviz, one must examine how it treats feature domains. When a tree makes a decision, it performs a "split"—comparing a feature value against a learned threshold.
Decoding the Decision Path
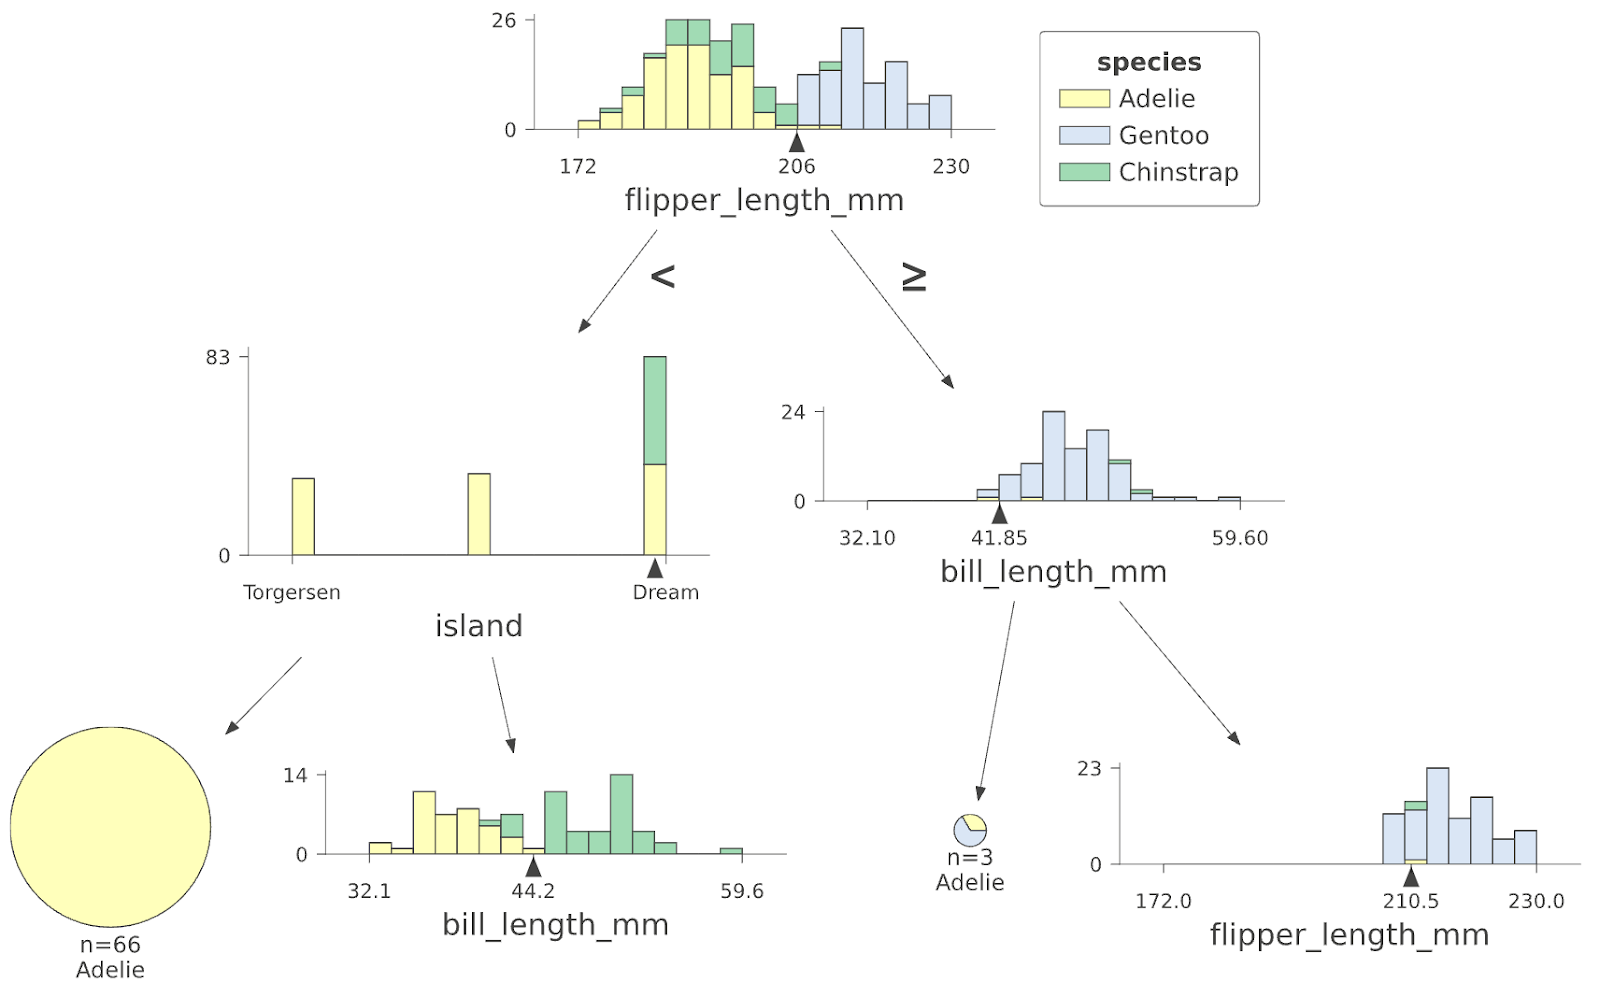
Consider a classification task involving the Palmer Penguins dataset. A standard visualization might show a node testing flipper_length_mm < 206. dtreeviz goes further, overlaying the distribution of the training data at that specific node. By visualizing the density of data points on either side of the split, users can immediately identify if a decision is based on a clean separation of classes or if the model is struggling with overlapping, ambiguous data.
Feature Mapping and Individual Inference
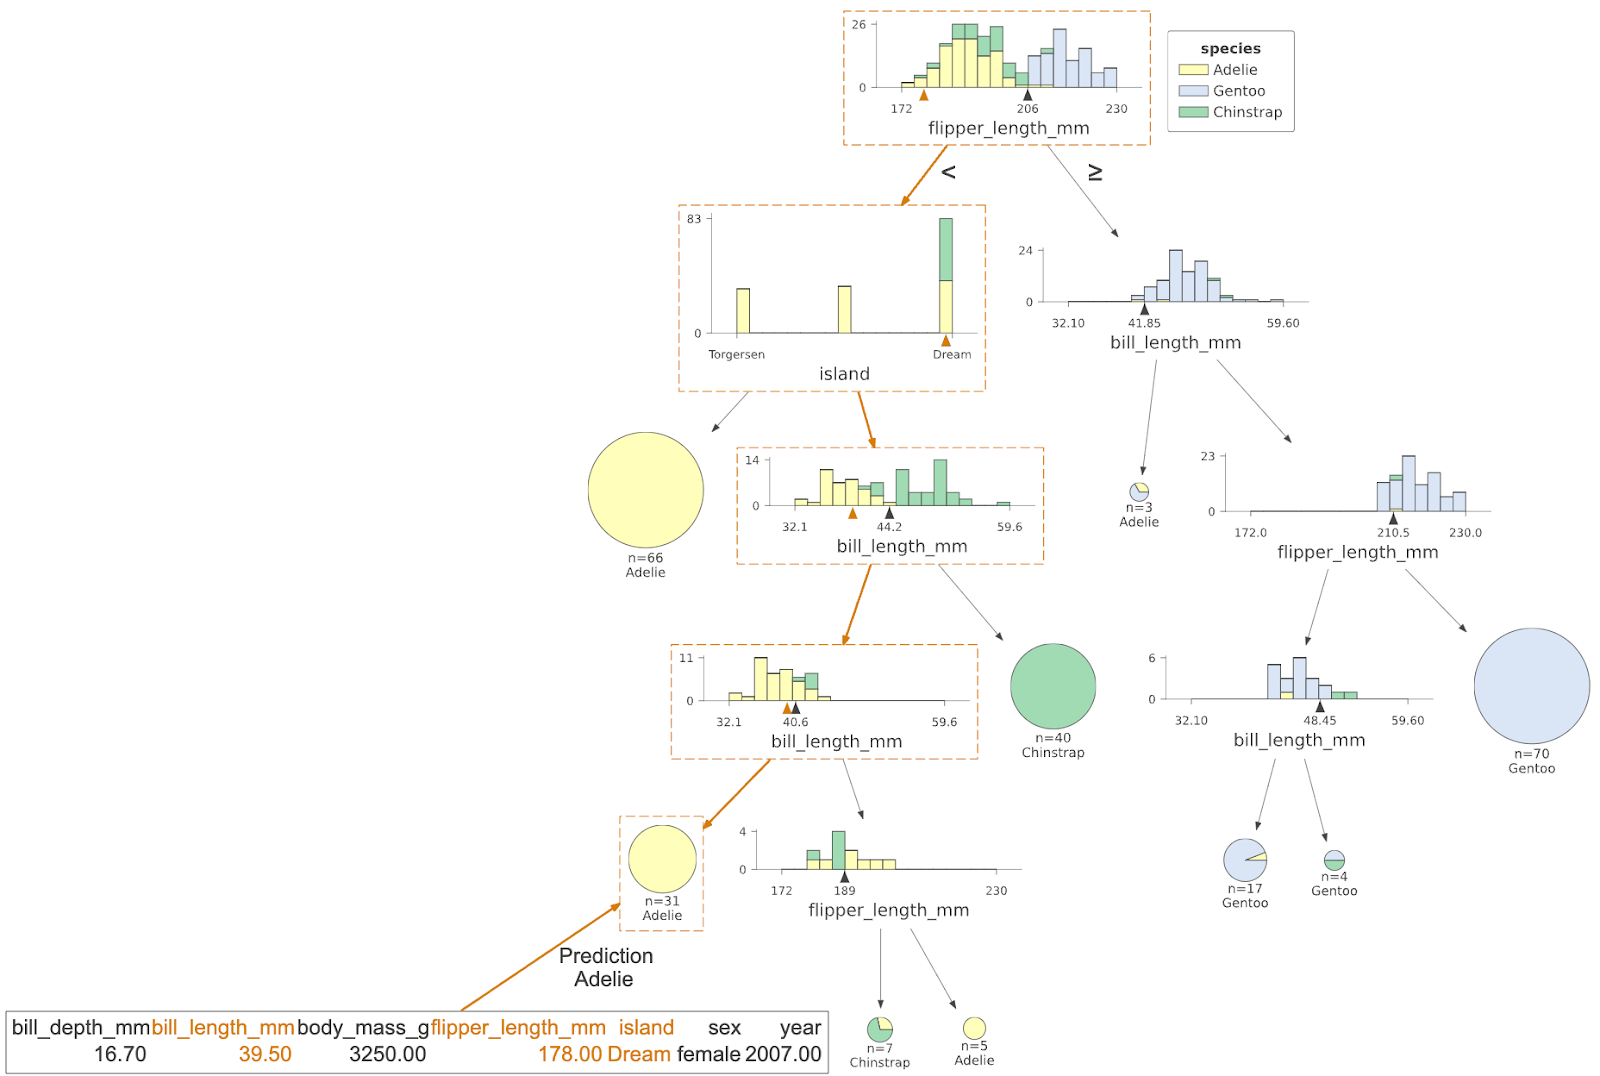
One of the most powerful features of the library is its ability to trace a single, specific test instance. If an organization uses a model to deny a loan, auditors need to know the exact path that led to that rejection. dtreeviz highlights the path taken through the tree, showing which features were evaluated and where the instance fell in the distribution of its leaf node. This provides a clear, defensible audit trail for model decisions.
Quantifying Leaf Contents
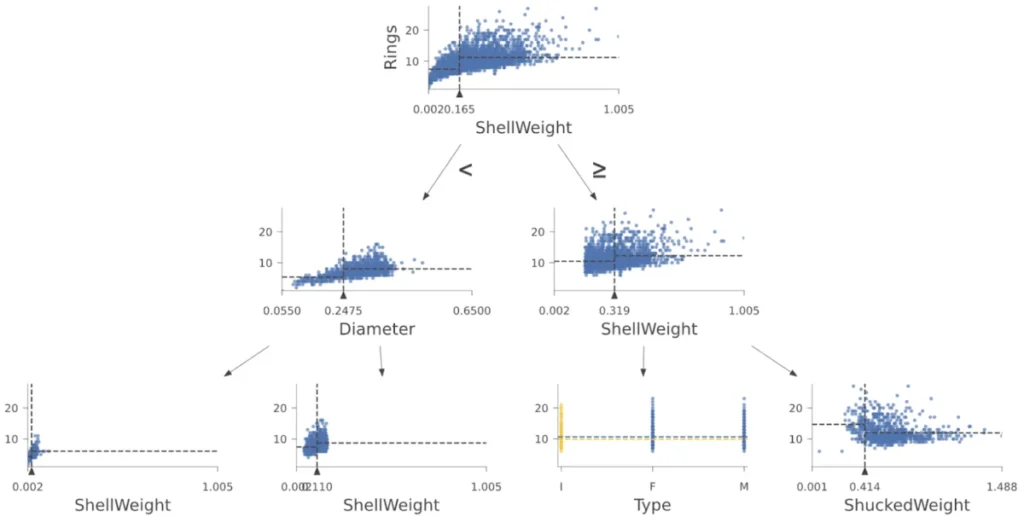
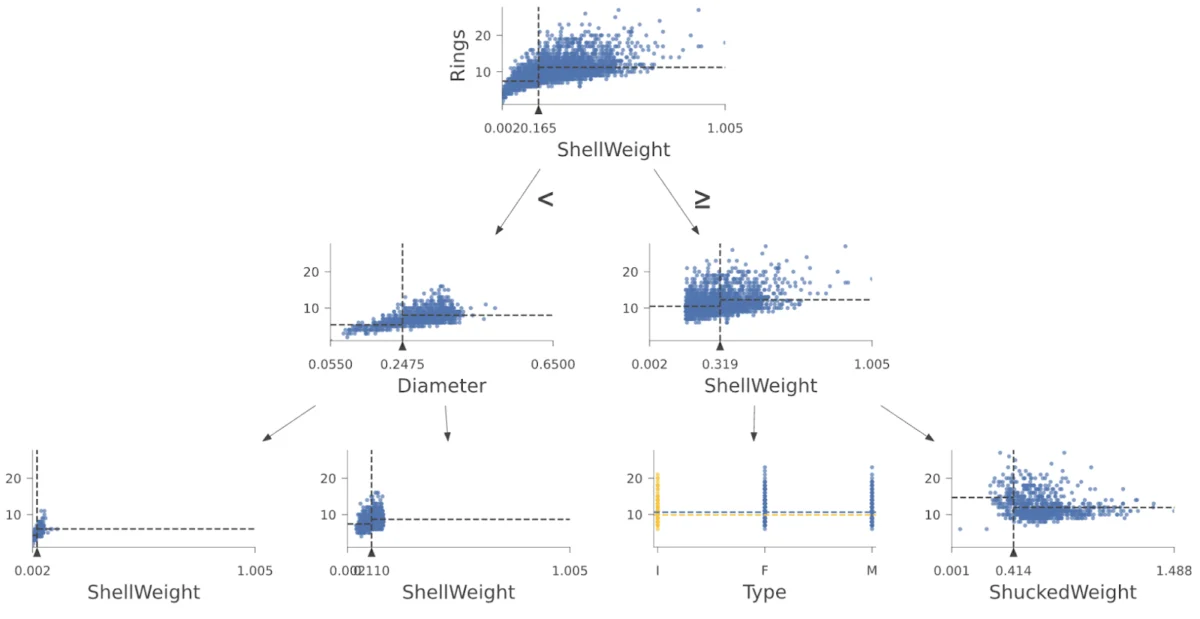
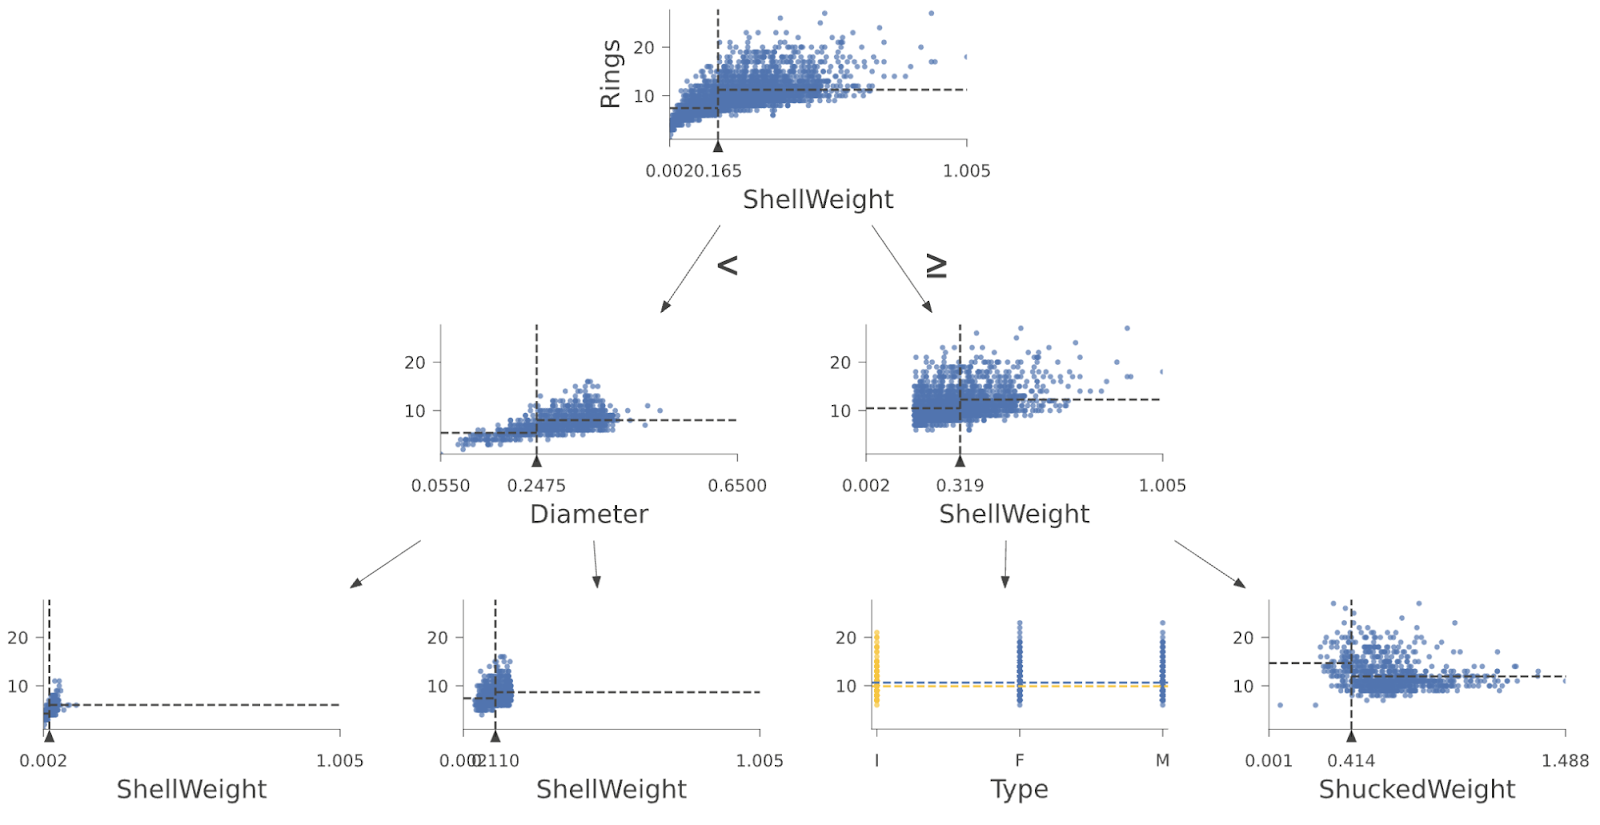
Beyond the tree structure, the library provides diagnostic plots for leaf nodes. For regressors, this means plotting the distribution of target variables (such as the number of rings in an Abalone dataset) within each leaf. For classifiers, it generates bar diagrams that display the ratio of samples-per-class. This allows data scientists to spot "impure" leaves—where a model is making a prediction with high uncertainty—allowing them to prune or retrain the model for better stability.
Official Perspectives and Expert Implementation
The integration of dtreeviz into the TensorFlow Decision Forests (TF-DF) toolkit represents an official endorsement of the importance of model transparency. According to documentation provided by Google, the process of implementation is streamlined to minimize friction for developers.
To interpret a classifier model (cmodel), the developer simply needs to wrap the model and the training data:
# Extracting features and labels
penguin_features = [f.name for f in cmodel.make_inspector().features()]
penguin_label = "species"

# Configuring the visualization model
viz_cmodel = dtreeviz.model(cmodel,
                            tree_index=3, # Selecting a specific tree
                            X_train=train_ds_pd[penguin_features],
                            y_train=train_ds_pd[penguin_label],
                            feature_names=penguin_features,
                            target_name=penguin_label,
                            class_names=classes)

# Rendering the visualization
viz_cmodel.view()
This code snippet underscores the library’s design philosophy: powerful diagnostics should be accessible with minimal boilerplate code. By allowing developers to "pick a tree from the forest," dtreeviz acknowledges that while ensemble models like Random Forests are vast, the individual trees within them hold the keys to understanding the model’s behavior.
Implications: Building Trust in AI
The implications of widespread dtreeviz adoption extend far beyond mere convenience. In regulated industries—such as finance, healthcare, and insurance—"black box" models are increasingly becoming a liability. Regulators are demanding greater explainability (XAI), and companies are finding that they cannot deploy high-stakes models without a clear understanding of the decision-making logic.
1. Enhanced Debugging and Feature Engineering
By visually inspecting splits, data scientists can identify "shortcuts" the model might be taking. If a tree is splitting on an irrelevant or biased feature, the visual representation makes that flaw immediately obvious, allowing for rapid course correction in the feature engineering stage.
2. Stakeholder Communication
Explaining a Gradient Boosted Tree to a non-technical stakeholder is notoriously difficult. With dtreeviz, practitioners can present clear, visual evidence that demonstrates how a model distinguishes between categories. This transparency builds trust between the data science team and business leadership, facilitating better decision-making based on model output.
3. Ethical AI and Bias Detection
When a model makes a biased decision, it is often hidden in the depths of the tree’s logic. By visualizing the training instances at each leaf, developers can detect if certain groups are being unfairly categorized due to biased training data. This makes dtreeviz a vital tool for those committed to developing ethical and equitable AI.
Conclusion: The Path Forward
The partnership between TensorFlow and dtreeviz is more than a technical integration; it is a signal to the industry that model interpretability is no longer optional. As machine learning models continue to permeate every aspect of our lives, the ability to "look under the hood" is essential for safety, compliance, and optimization.
Whether you are a researcher analyzing the nuances of the Abalone dataset or an enterprise developer deploying a predictive model for millions of users, the tools to demystify your trees are readily available. By leveraging the visual insights provided by dtreeviz, you can move away from the limitations of the "black box" and toward a future of transparent, auditable, and truly understandable artificial intelligence.
To get started, developers are encouraged to visit the official TensorFlow tutorial and begin mapping the logic of their own models today.