Kubernetes 1.36 Ushers in New Era of Observability with General Availability of Pressure Stall Information (PSI)
By Maria Fernanda Romano Silva (Google Cloud) | May 12, 2026
In the complex landscape of distributed systems, the "silent failure"—where a node appears healthy according to traditional metrics but is functionally failing its workloads—has long been the bane of Site Reliability Engineers (SREs). With the official release of Kubernetes v1.36, the community has reached a significant milestone in observability: the General Availability (GA) of Pressure Stall Information (PSI). This development marks a transition from reactive resource management to a proactive, high-fidelity understanding of system health.
The Core Concept: Beyond Traditional Utilization
For years, cluster operators have relied on standard utilization metrics: CPU percentage, memory usage, and I/O throughput. While these metrics are foundational, they are fundamentally incomplete. A node reporting 70% CPU utilization might be perfectly healthy, or it might be a house of cards where critical threads are stalled waiting for CPU cycles, leading to application timeouts and erratic latency.
Pressure Stall Information, originally introduced into the Linux kernel in 2018, solves this "blind spot" problem. Instead of measuring how much of a resource is being used, PSI measures how much time a task spends waiting for a resource. By tracking the duration that tasks are stalled, the kernel provides a precise signal of resource contention. Kubernetes v1.36 brings this capability to the container orchestration layer, exposing these signals at the node, pod, and container levels.
A Chronology of Progress: From Alpha to GA
The journey to bring PSI to the Kubernetes ecosystem was a multi-year effort spearheaded by SIG Node. The project’s trajectory reflects the community’s commitment to stability and rigorous performance validation.

- 2018: Linux kernel introduces PSI, providing the underlying kernel-level hooks for measuring resource pressure.
- Early 2025 (v1.33): The feature enters the Alpha stage. Initial implementation allows for testing the integration of kernel signals into the Kubelet’s telemetry reporting.
- Late 2025 (v1.34): PSI transitions to Beta. This phase focused on refining the API, ensuring cross-platform compatibility, and gathering feedback from early adopters running high-density production workloads.
- May 2026 (v1.36): PSI achieves General Availability. The interface is now stable, and the feature is enabled by default, requiring no specific feature gates to function on compatible Linux distributions.
Performance at Scale: The SIG Node Validation
One of the primary concerns regarding the introduction of new observability features is "telemetry tax"—the overhead required to collect and export data. For a platform as resource-sensitive as Kubernetes, adding additional monitoring loops could theoretically impact the very performance metrics it seeks to track.
To address these concerns, SIG Node conducted exhaustive testing on high-density clusters, simulating scenarios with over 80 pods per node. The testing was bifurcated into two distinct vectors: the Kubelet’s data collection overhead and the kernel-level bookkeeping overhead.
Analyzing Kubelet Overhead
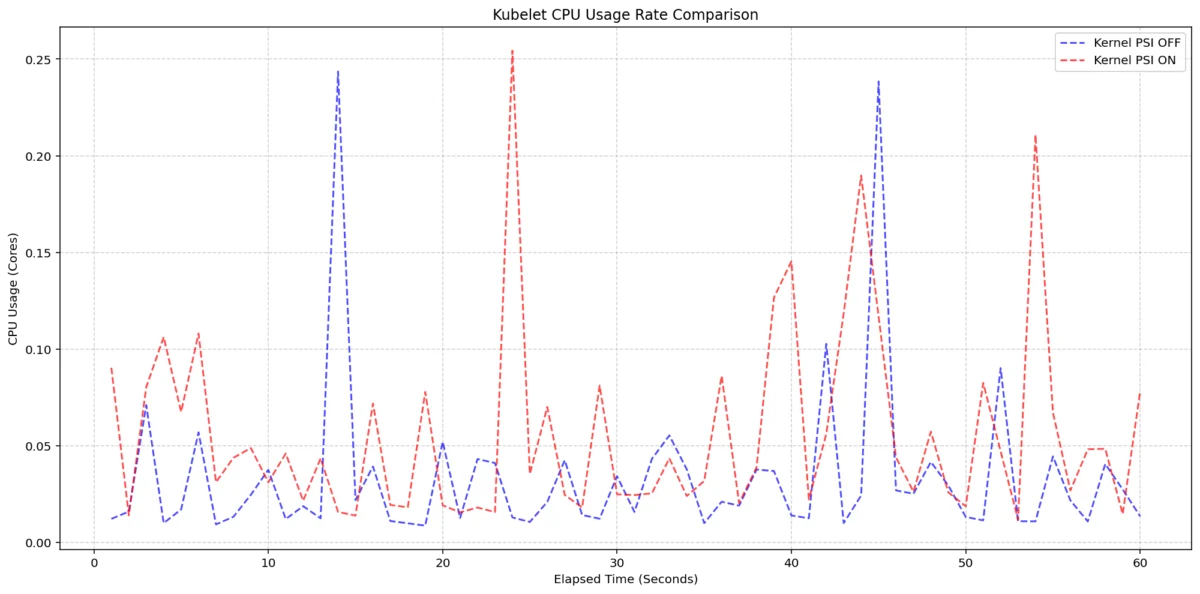
In the first scenario, researchers evaluated the Kubelet’s resource usage on 4-core machines. By toggling the KubeletPSI feature gate, the team compared baseline system behavior against a system actively polling and exposing PSI metrics. The results were definitive: the Kubelet’s collection logic is remarkably lightweight. The synchronized bursts in CPU usage were nearly identical between the enabled and disabled states. The additional CPU footprint remained within 0.1 cores, or approximately 2.5% of total node capacity. This confirms that the data gathering process integrates seamlessly into existing housekeeping cycles without introducing performance degradation.
Evaluating Kernel-Level Bookkeeping
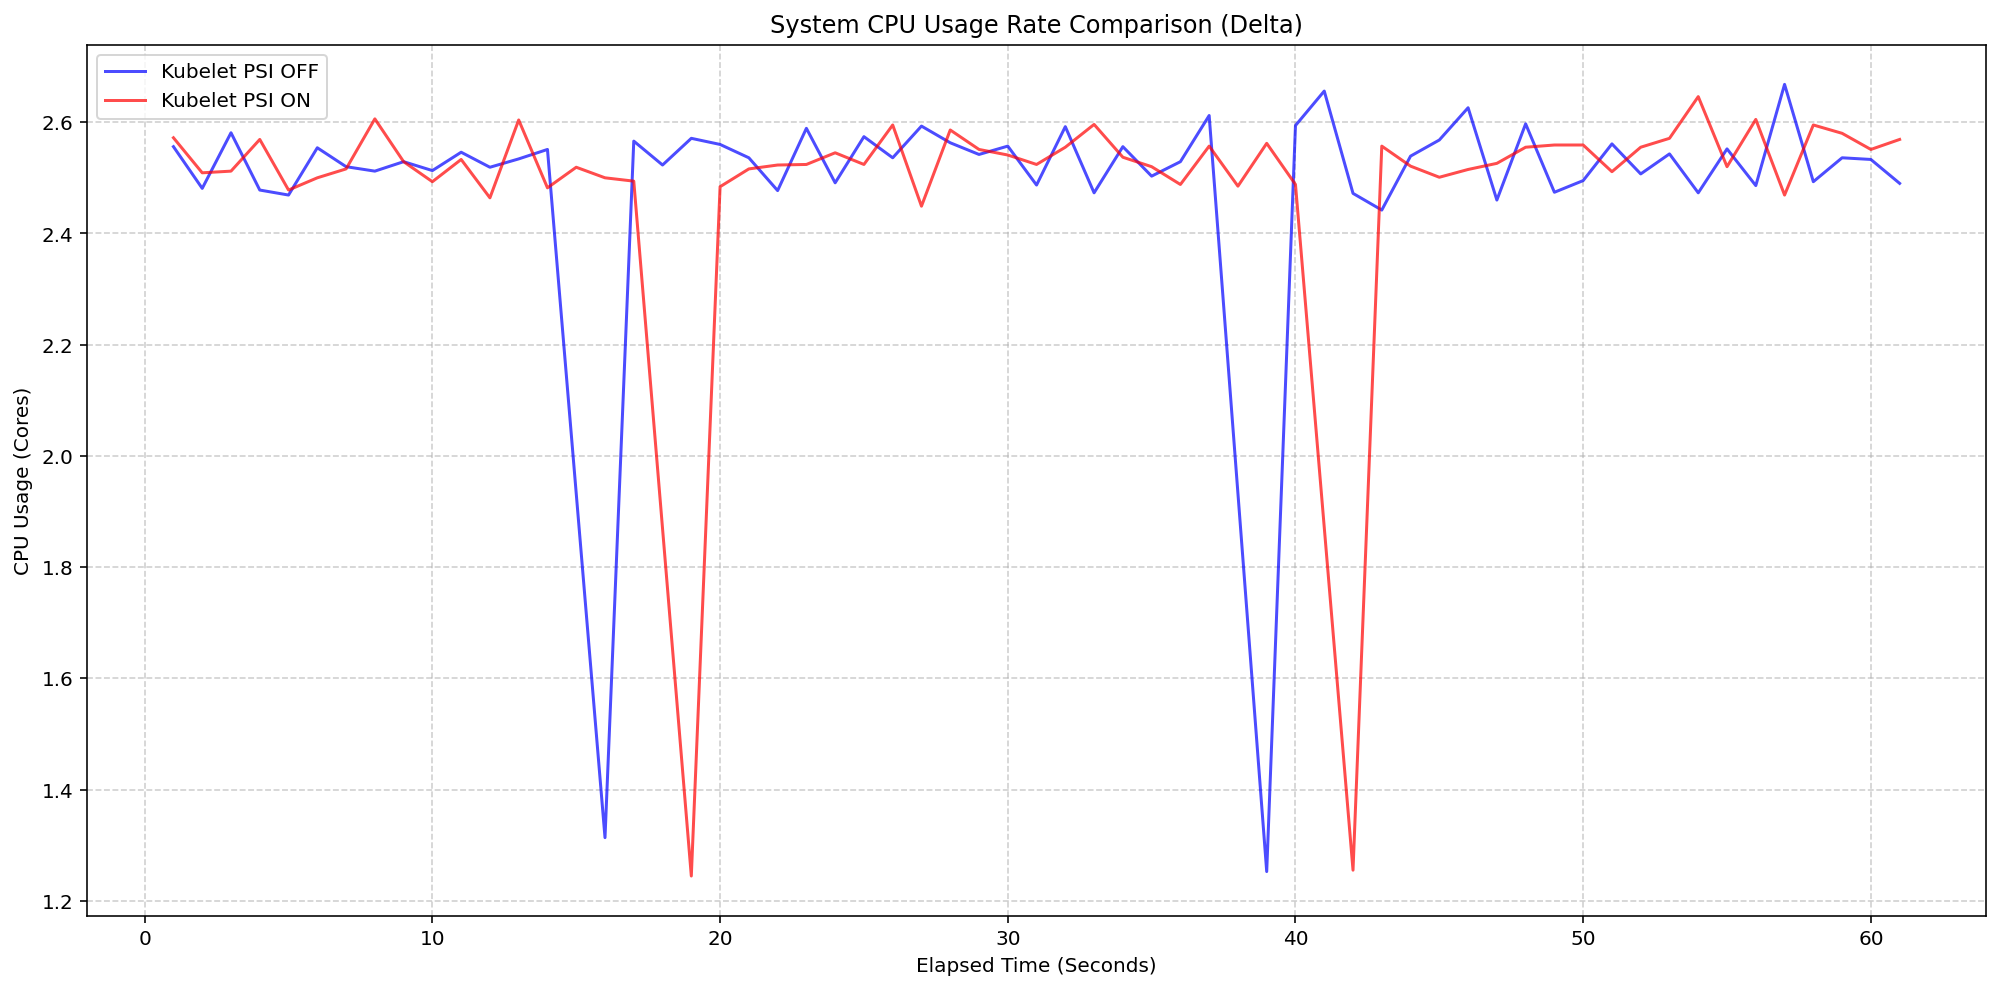
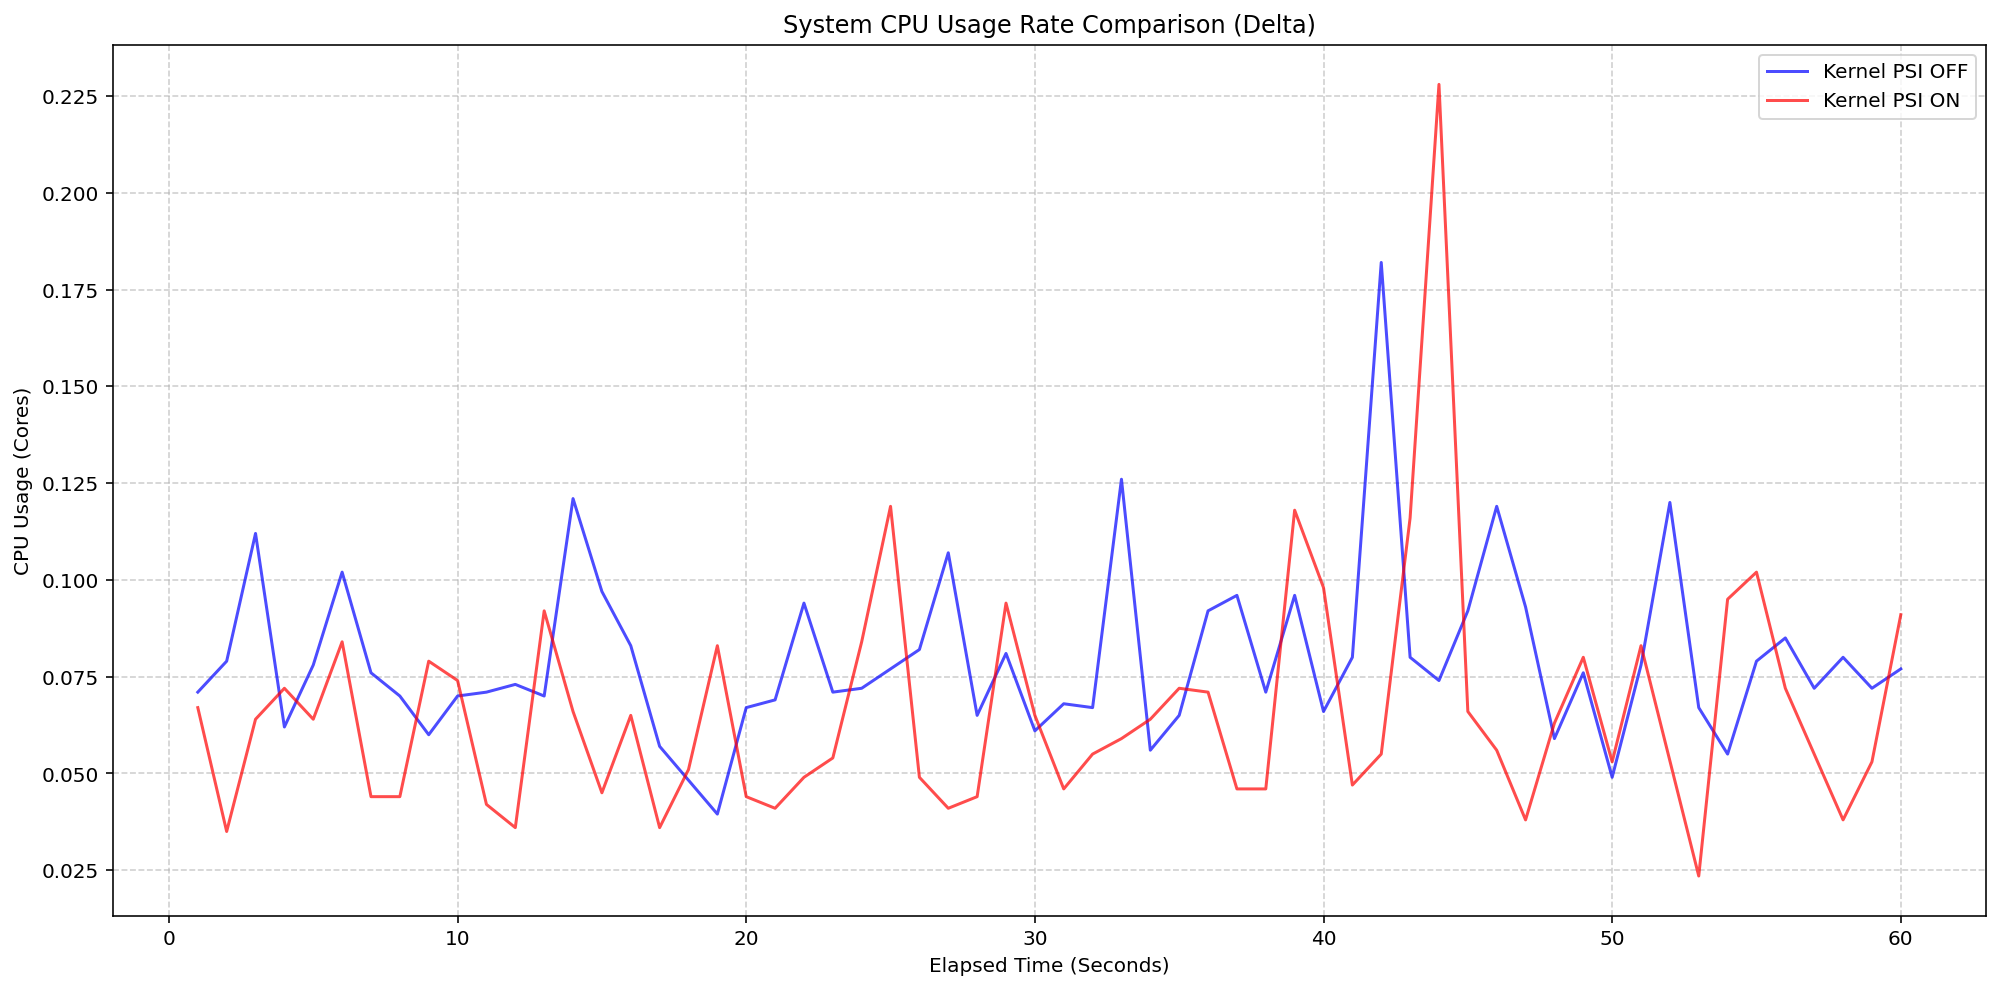
The second scenario isolated the cost of the Linux kernel’s internal PSI tracking. By comparing clusters running with psi=1 versus psi=0, the team isolated the raw cost of the kernel’s internal accounting. Under extreme I/O and CPU stress—at 80-pod density—the system CPU delta remained consistently between 0.925% and 3.125% of total capacity. While a single transient spike to 5.6% was observed, it was rapidly normalized. These findings demonstrate that the kernel’s PSI implementation is highly optimized, making it safe for production-scale environments even on modest hardware.
Implications for Production Environments
The GA of PSI in Kubernetes v1.36 carries profound implications for how SREs manage the "Resource Overcommit" dilemma. By providing a direct measure of stall time, PSI allows for more aggressive bin-packing of containers without the traditional risk of "noisy neighbor" effects spiraling into unmonitored outages.
Improved Latency Debugging
For microservices architectures, latency is the primary KPI. With PSI, developers can now correlate application-level latency spikes directly with node-level pressure metrics. If a service experiences a latency spike, an operator can immediately query the cpu.psi, memory.psi, or io.psi metrics to determine if the issue is internal to the application or if the container is being throttled by the host kernel due to resource contention.
Advanced Autoscaling Capabilities
The integration of PSI into the Kubelet also paves the way for a new generation of horizontal pod autoscalers. Rather than relying on simple CPU utilization thresholds—which are often lagging indicators—autoscalers can now be configured to react to actual resource pressure. This allows for faster scaling responses before the application reaches a point of failure, enhancing the overall resilience of the cluster.
Getting Started with PSI
As of Kubernetes v1.36, the feature is generally available on all Linux nodes. It is important to note that PSI is a Linux-kernel feature; consequently, these metrics are not available on Windows nodes. In a mixed-OS cluster, the Kubelet will simply omit PSI data for Windows-based workloads, ensuring no adverse effects on cross-platform operations.
For administrators, the data is accessible via the cadvisor endpoint. This allows for seamless integration with existing monitoring stacks such as Prometheus, Grafana, or Datadog. For those requiring real-time insights, the Summary API can be accessed via the control plane:
CONTAINER_NAME="example-container"
kubectl get --raw "/api/v1/nodes/$(kubectl get nodes -o jsonpath='.items[0].metadata.name')/proxy/stats/summary" | jq '.pods[].containers[] | select(.name=="'$CONTAINER_NAME'") | name, cpu: .cpu.psi, memory: .memory.psi, io: .io.psi'
Note: Proxying to the Kubelet is a privileged operation. Ensure that RBAC policies are strictly enforced to prevent unauthorized access to node-level metrics.
Official Perspectives and Community Acknowledgement
The transition of PSI from a kernel-level feature to a standard Kubernetes telemetry stream was a result of intense, cross-functional collaboration within SIG Node. Contributors emphasized that the design philosophy was "non-intrusive observability." By utilizing the existing cgroup hierarchy, the implementation avoids the need for sidecars or additional agents, keeping the node footprint lean.
The SIG Node leadership expressed gratitude to the many contributors who spent the last 18 months refining the API and documentation. "The goal was never just to add more metrics," said a project spokesperson. "The goal was to provide actionable signals that tell the story of what is actually happening inside the container runtime."
Looking Ahead
With PSI now established as a core component of the Kubernetes metrics suite, the community is already looking toward future enhancements. Potential areas for further development include integrating PSI metrics into the Vertical Pod Autoscaler (VPA) and expanding support for more granular kernel-level diagnostics.
As the industry moves toward increasingly dense container deployments, the ability to discern the difference between a busy system and a stalled system will become a competitive advantage. Kubernetes v1.36, by shedding light on these hidden bottlenecks, provides the clarity needed to navigate the challenges of modern infrastructure at scale.
For those interested in contributing or providing feedback, the SIG Node group remains active on the public Kubernetes Slack (#sig-node) and welcomes participation in their bi-weekly community meetings. As we move into this new era of observability, the data provided by PSI will undoubtedly become a cornerstone of reliable, high-performance cloud-native architecture.