Unlocking Peak Performance: A Deep Dive into Google’s New Android Performance Analyzer
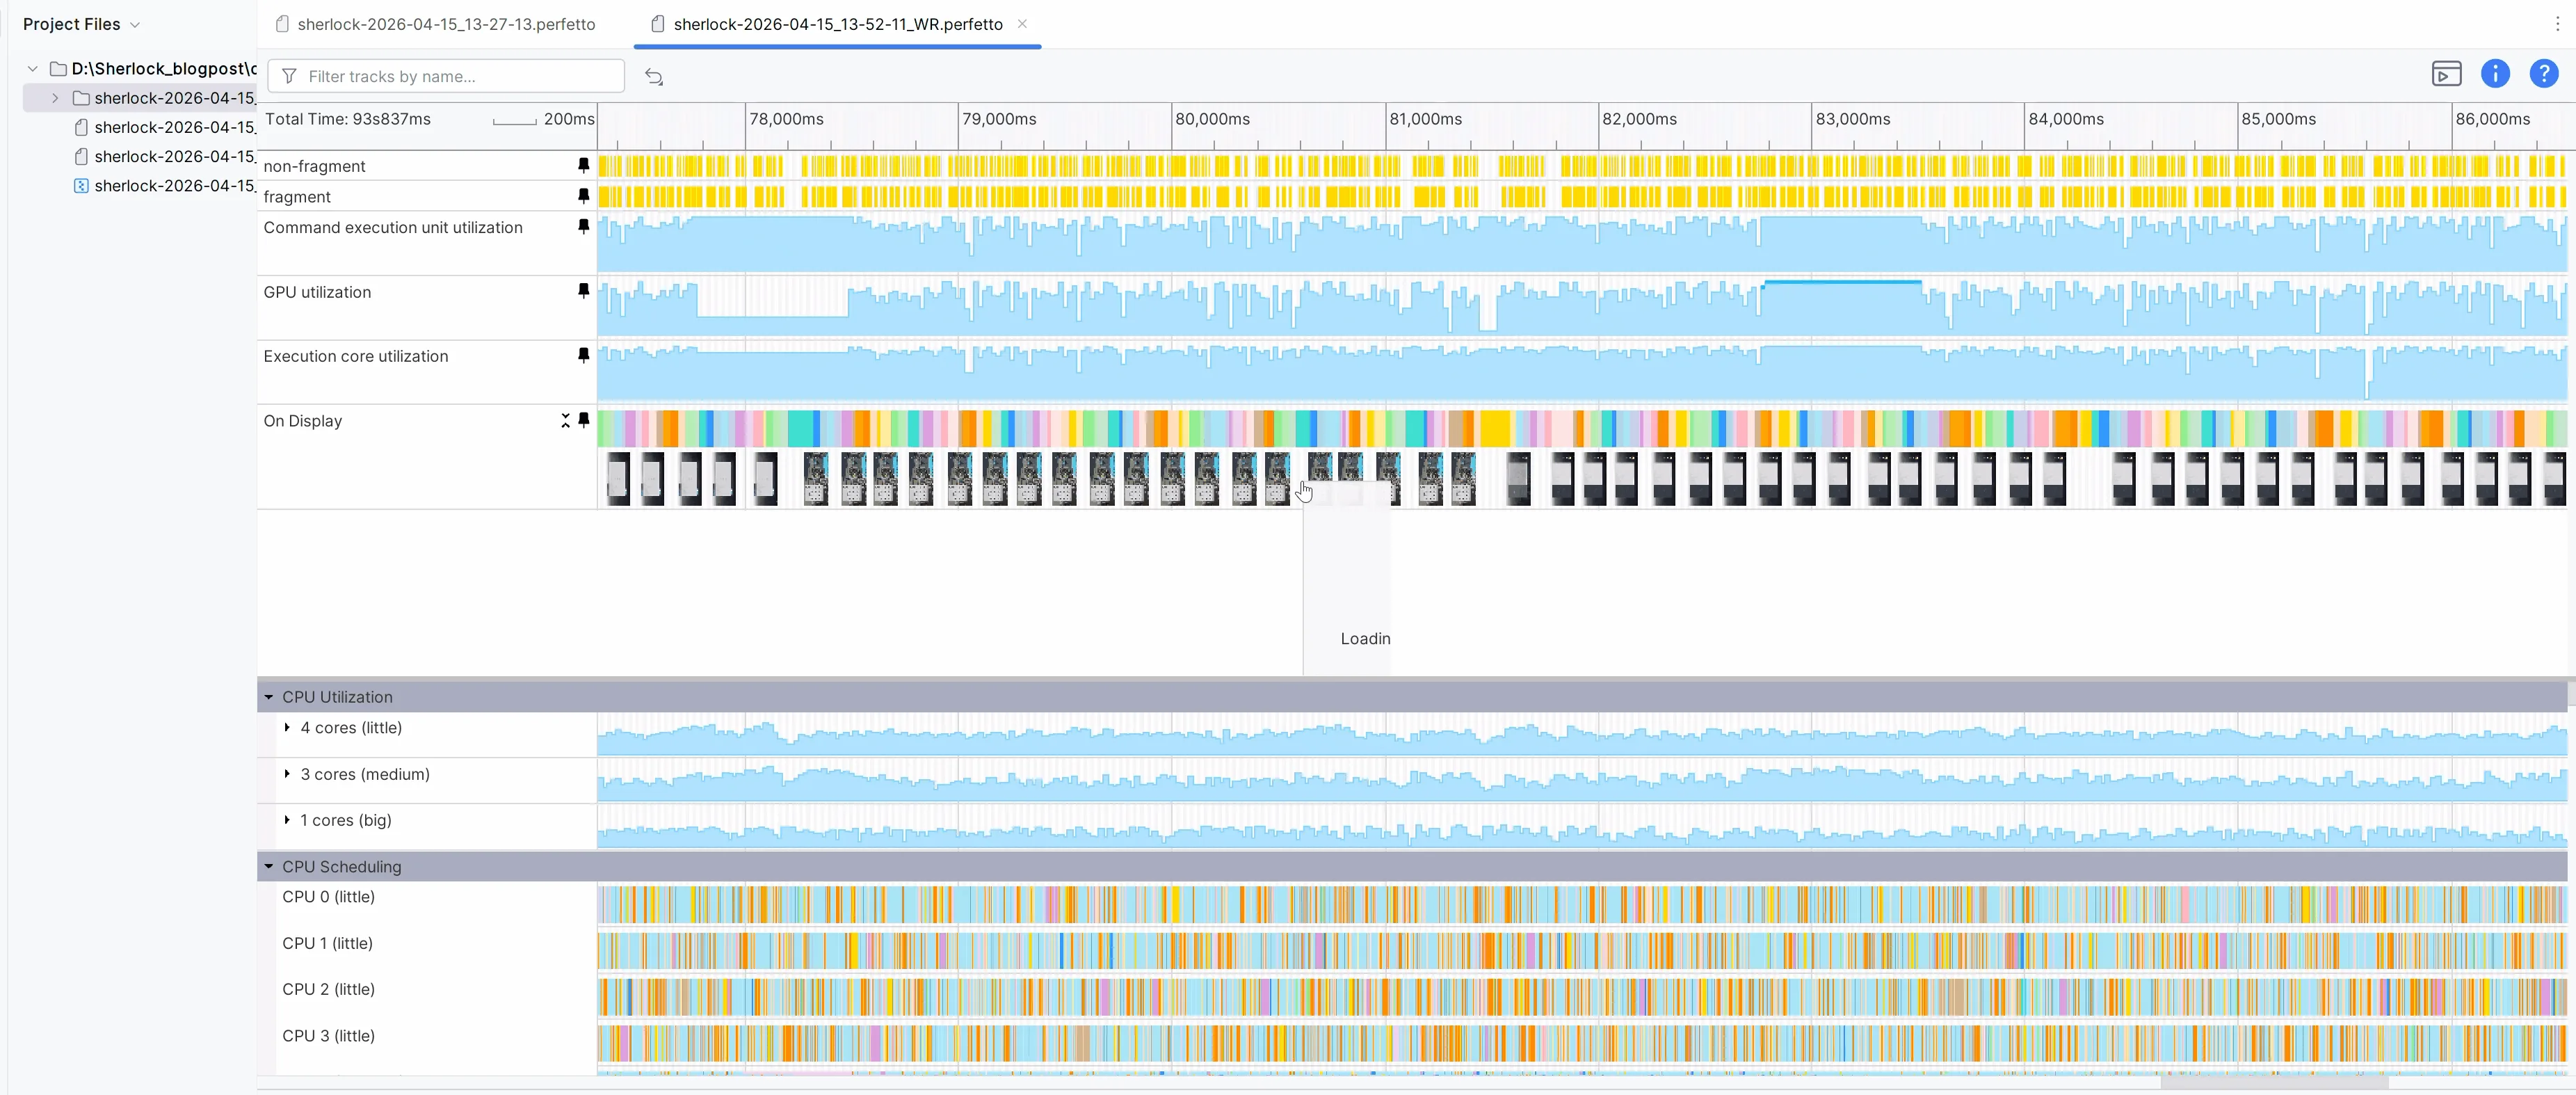
In the high-stakes world of mobile software development, the difference between a top-tier application and one that suffers from "jank," battery drain, or thermal throttling often comes down to the quality of the developer’s toolkit. As modern Android devices push the boundaries of hardware capabilities—incorporating complex multi-core CPUs, advanced GPUs, and sophisticated AI-driven background processes—the task of optimizing software has become exponentially more difficult.
Today, Google has taken a major step toward simplifying this complexity with the launch of the Android Performance Analyzer (APA). Now available in open beta, this powerful profiling tool is designed to provide developers with unprecedented visibility into how their code interacts with the underlying Android system. Developed in collaboration with the Samsung Austin Research Center (SARC) and LunarG, the APA promises to be the new gold standard for performance-minded engineers, particularly those leveraging the Vulkan graphics API to build high-fidelity gaming experiences.

Main Facts: What is the Android Performance Analyzer?
At its core, the Android Performance Analyzer is a comprehensive profiling suite tailored for the Android mobile ecosystem. Unlike legacy tools that often require fragmented workflows, the APA provides a unified interface where developers can monitor CPU, GPU, memory, and power consumption in real-time.
By utilizing the robust Perfetto tracing framework, the APA offers deep-dive system analysis. Whether you are an indie developer looking to shave a few milliseconds off your app’s startup time or a professional studio optimizing a graphics-heavy 3D title, the APA is built to handle the scale. It allows developers to capture performance data either at application launch or during specific user-triggered events, offering a level of control that was previously elusive.

The tool is cross-platform, functioning natively on Windows, macOS, and Linux, ensuring that no matter the development environment, the power of APA remains accessible. For devices running Android 12 and higher, the integration is particularly deep, allowing for granular tracking of GPU counters, render stages, and system-wide synchronization.
A Chronology of Performance Evolution
The journey to the Android Performance Analyzer did not happen in a vacuum. For years, Android developers relied on a suite of disparate tools—ranging from the Android Studio Profiler to specialized GPU inspectors. While these tools were functional, they often lacked the "birds-eye" view required to understand the complex interplay between different hardware subsystems.

- Foundational Research: Google initiated a multi-year effort to identify the primary friction points in mobile optimization. By partnering with industry giants like Samsung (via SARC) and graphics experts at LunarG, Google sought to build a tool that didn’t just report data, but provided actionable insights.
- The Integration Phase: The project focused on integrating existing industry standards, specifically Perfetto for tracing and GFXReconstruct for graphics capture and replay. This decision ensured that APA would not be a "walled garden" but rather an extensible platform.
- Alpha and Beta Testing: Throughout late 2025 and early 2026, select studios—including The Forge and Netmarble—were granted early access. Their feedback helped shape the UI/UX, leading to the development of the "project-based workflow" and the "screenshot navigation" features that define the current beta.
- Public Launch (Google I/O 2026): The tool officially entered open beta today, signaling a shift in Google’s strategy toward providing more professional-grade, stand-alone diagnostic tools for the developer community.
Supporting Data: The Technical Edge
The technical improvements brought by the APA are not merely incremental; they are structural. In internal testing, rendering a trace within the APA was found to be between 6x and 26x faster than the legacy Android GPU Inspector. This speed improvement is critical, as it allows developers to iterate on their code and re-test performance without the "waiting game" that characterized previous profiling cycles.
Key Technical Capabilities:
- Visual Navigation: A standout feature is the ability to scrub through the timeline using captured screenshots. This allows a developer to look at a frame of their game, see a visual stutter, and immediately pinpoint the exact slice of performance data responsible for that frame.
- Custom SQL Analysis: For power users, the APA supports custom SQL queries via the Perfetto engine. This allows developers to write specific code to calculate complex metrics—such as total rendering cost per frame—across thousands of data points.
- AI-Assisted Diagnostics: Perhaps the most futuristic addition is the integration of AI agents. Developers can now ask, "Why is my app startup slow?" and the AI will analyze the SQL schemas and trace data to provide a plain-English explanation and a starting point for investigation.
- Vulkan Debug Markers: The tool respects Vulkan debug annotations, allowing developers to see their own named render passes directly in the profiler. This bridges the gap between the abstract "codebase" and the "hardware execution."
Official Perspectives and Industry Validation
The efficacy of the Android Performance Analyzer has already been validated through several high-profile case studies.

The Forge Interactive, a premier graphics engineering studio, utilized the APA to optimize their engine’s CPU setup costs. By identifying inefficient binding calls in their Vulkan implementation, they were able to reduce setup costs by roughly 50%. "The ability to visualize the impact of our code on thermal output and CPU scheduling was a game-changer," a spokesperson for the studio noted. The resulting optimization not only improved frame stability but also extended battery life for end-users, effectively slowing heat production by 2–3x.
Similarly, Netmarble, the creators behind Seven Deadly Sins: Origin, used the tool to tackle GPU bottlenecks. By analyzing shader precision and upscaling impacts, they achieved a massive 90% reduction in GPU costs for specific complex scenes.

Google’s own team, while optimizing the Filament rendering engine, used the tool to refine their glTF Viewer. By identifying scenes that were too complex for the hardware, they were able to implement dynamic resolution scaling and texture compression, effectively keeping the application at a stable 60 FPS without sacrificing visual fidelity.
Implications: The Future of Android Development
The release of the Android Performance Analyzer marks a pivotal shift in the mobile ecosystem. As mobile devices continue to close the gap with desktop gaming hardware, the expectation for console-quality performance on phones increases. Tools like the APA are no longer optional "nice-to-haves"; they are essential components of the modern software development lifecycle.

Improving User Retention
For the end user, these improvements manifest as smoother animations, longer battery life, and less thermal throttling. Developers who adopt the APA early will likely see higher user retention rates, as their apps will be perceived as more reliable and "polished" compared to those that remain unoptimized.
Democratizing Advanced Optimization
By integrating AI to help construct complex SQL queries, Google is effectively lowering the barrier to entry for advanced performance profiling. Engineers who may not have been experts in Perfetto SQL can now perform high-level queries, making professional-grade optimization accessible to smaller teams and individual developers.

A Unified Ecosystem
Finally, the project-based workflow suggests that Google intends for the APA to become a central hub for performance tracking. By allowing developers to store multiple traces, run longitudinal tests, and compare A/B performance results in a single, tabbed interface, Google is encouraging a culture of continuous performance monitoring rather than "one-off" debugging.
Conclusion: How to Get Started
The Android Performance Analyzer is currently available for download as an open beta. Because it is pre-release software, developers are encouraged to use the built-in feedback loop (Help Menu > Submit a bug report) to assist the engineering team in refining the experience.

For those attending Google I/O 2026, the APA represents one of the most significant developer-centric announcements of the year. As the tool continues to evolve—with frame profiling and debugging features already teased for future updates—it is clear that Google is committed to providing the infrastructure necessary for the next generation of high-performance Android applications. Whether you are building the next breakout mobile game or a productivity tool that requires maximum efficiency, the Android Performance Analyzer is a critical addition to your development toolkit.