Kubernetes 1.36: Achieving Observability Maturity with Pressure Stall Information (PSI)
By Maria Fernanda Romano Silva (Google Cloud) | Tuesday, May 12, 2026
In the complex ecosystem of cloud-native infrastructure, the "utilization trap" has long been a thorn in the side of cluster administrators. For years, teams have relied on CPU and memory usage percentages as their primary north star for health. However, as Kubernetes environments have grown in density and complexity, these metrics have increasingly failed to paint the full picture. A node might report 80% CPU utilization while mission-critical services suffer from catastrophic latency, or conversely, a node might appear idle while background tasks starve due to resource contention.
With the release of Kubernetes v1.36, the community has reached a significant milestone: the General Availability (GA) of Pressure Stall Information (PSI). By moving beyond simple utilization metrics, Kubernetes now provides a high-fidelity window into resource saturation, allowing operators to identify bottlenecks before they manifest as user-facing outages.
The Core Philosophy: Why Utilization is Not Enough
Traditional metrics like "CPU usage" describe how much of a resource is being consumed, but they remain largely silent on how much work is not being done. If a process is waiting for a CPU core to become available, or if it is stuck in an I/O wait state, standard utilization metrics might simply show the system is "busy."
Pressure Stall Information, originally introduced to the Linux kernel in 2018, flips the script. Instead of measuring consumption, PSI measures stalls. It tracks the exact amount of time tasks spend in a blocked state due to the unavailability of CPU, memory, or I/O resources. By quantifying this "lost time," PSI provides a granular, actionable signal: are my pods slow because the code is inefficient, or because the kernel is struggling to satisfy resource requests?
For the Kubernetes ecosystem, this represents a shift from reactive troubleshooting to predictive observability. With PSI now natively integrated at the node, pod, and container levels in v1.36, platform engineers can finally correlate application latency directly with infrastructure pressure.
A Chronology of Progress: From Concept to Production
The journey of PSI within Kubernetes has been a meticulous exercise in validation and community-driven development. The SIG Node group recognized early on that while PSI was a powerful kernel feature, exposing it safely within the container runtime environment required careful engineering to avoid adding "observability tax"—the performance overhead caused by the monitoring tools themselves.
- Alpha (v1.33): The initial implementation focused on feasibility, introducing the plumbing necessary for the Kubelet to tap into the kernel’s PSI accounting data. This phase was crucial for determining how to map cgroup-level PSI metrics to individual pods and containers.
- Beta (v1.34): The feature moved to beta, where the focus shifted to API stability and data accuracy. During this period, the community gathered telemetry on how PSI behaved across diverse kernel versions and machine types, ensuring that the metrics were not only accurate but also consistent.
- General Availability (v1.36): With the latest release, the feature gate has been removed. PSI metrics are now a first-class citizen in the Kubelet’s telemetry stack, requiring no special opt-in. This reflects the community’s confidence in the stability, security, and low-impact nature of the implementation.
Supporting Data: The Case for Low-Overhead Observability
A frequent concern among cluster operators when adopting new telemetry features is the potential for performance degradation. To ensure that PSI metrics did not come at the cost of node performance, SIG Node conducted rigorous, large-scale performance testing on high-density workloads, simulating environments with 80+ pods per node.
Scenario 1: The Kubelet Overhead
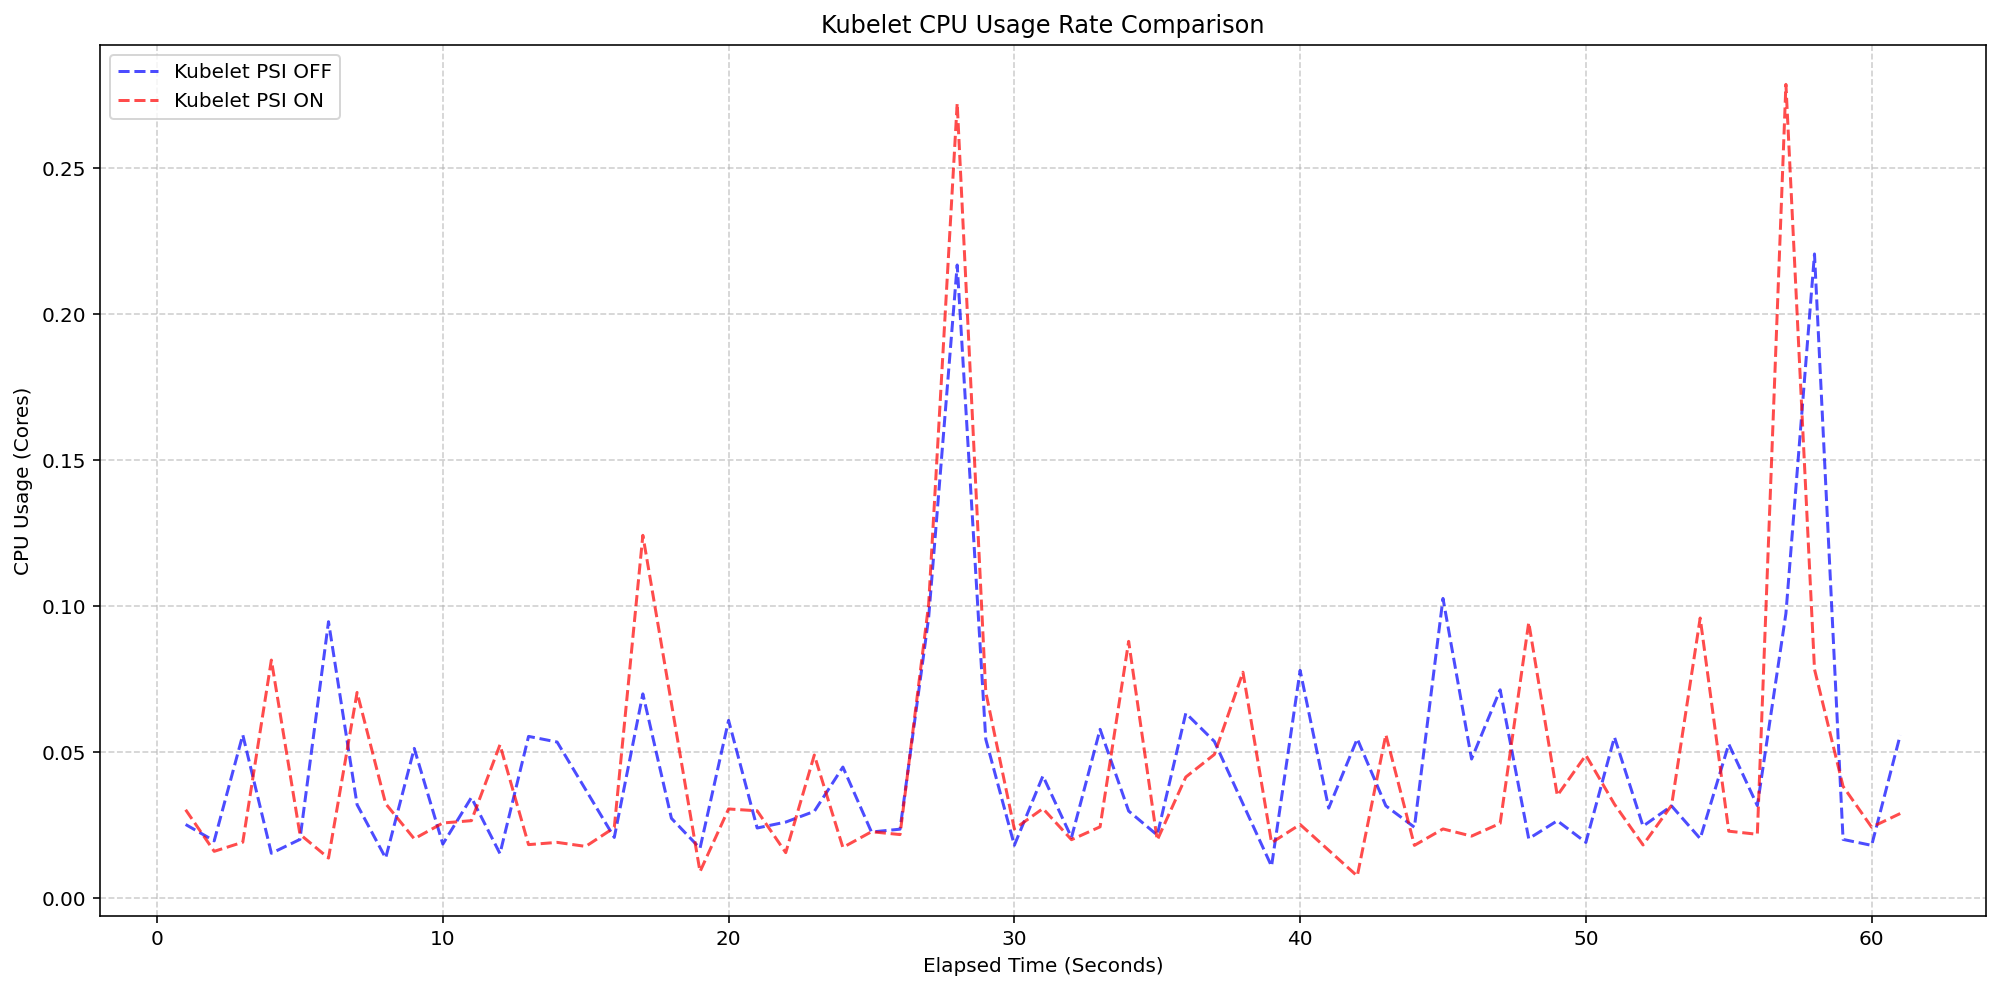
The first phase of testing evaluated the Kubelet’s resource footprint. By comparing clusters with the KubeletPSI feature enabled against those with it disabled, researchers observed that the collection logic is remarkably lightweight. The CPU usage of the Kubelet remained within the standard 0.1-core margin (approximately 2.5% of total node capacity), proving that the integration blends seamlessly into existing housekeeping cycles.
Scenario 2: The Kernel Overhead
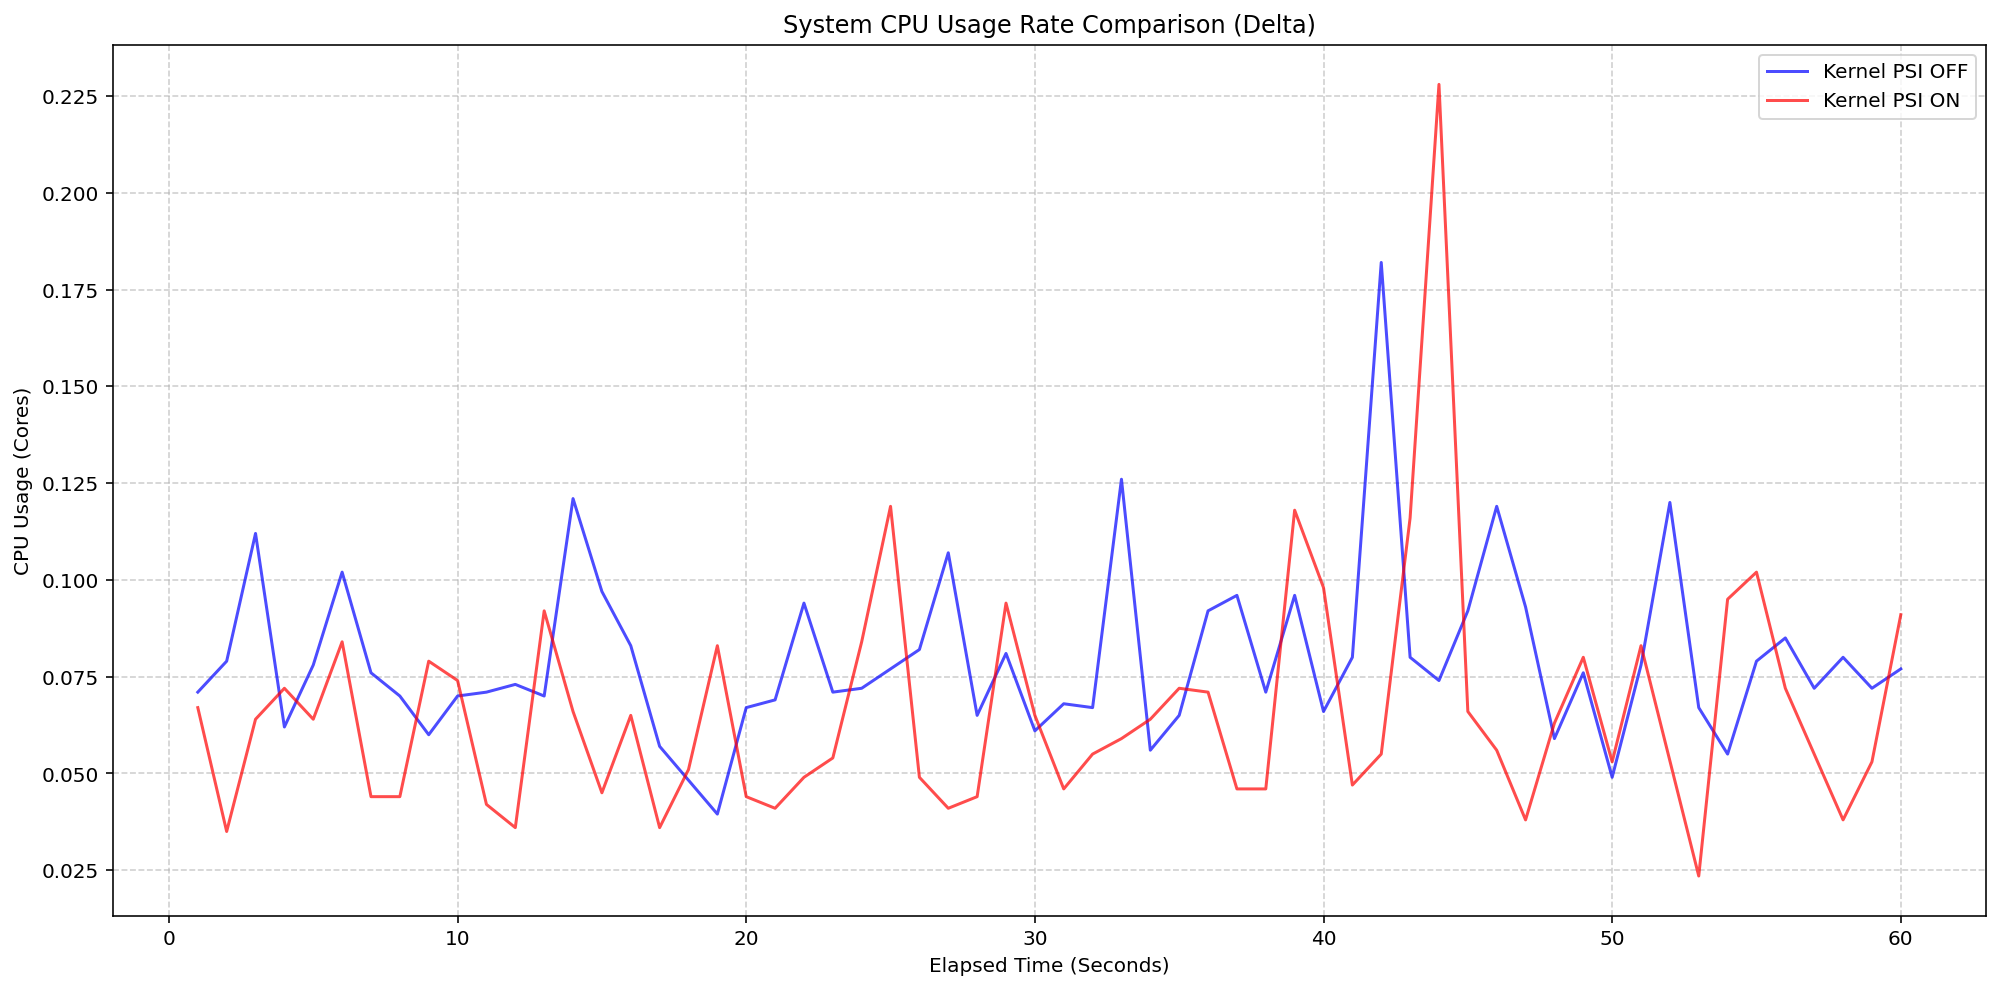
The second phase focused on the "system cost" of the kernel-level accounting itself. Even under extreme I/O and CPU stress, the overhead introduced by enabling PSI (using the psi=1 kernel boot parameter) remained between 0.037 and 0.125 cores. Even during brief, controlled spikes, the system overhead never breached a level that would jeopardize node stability.
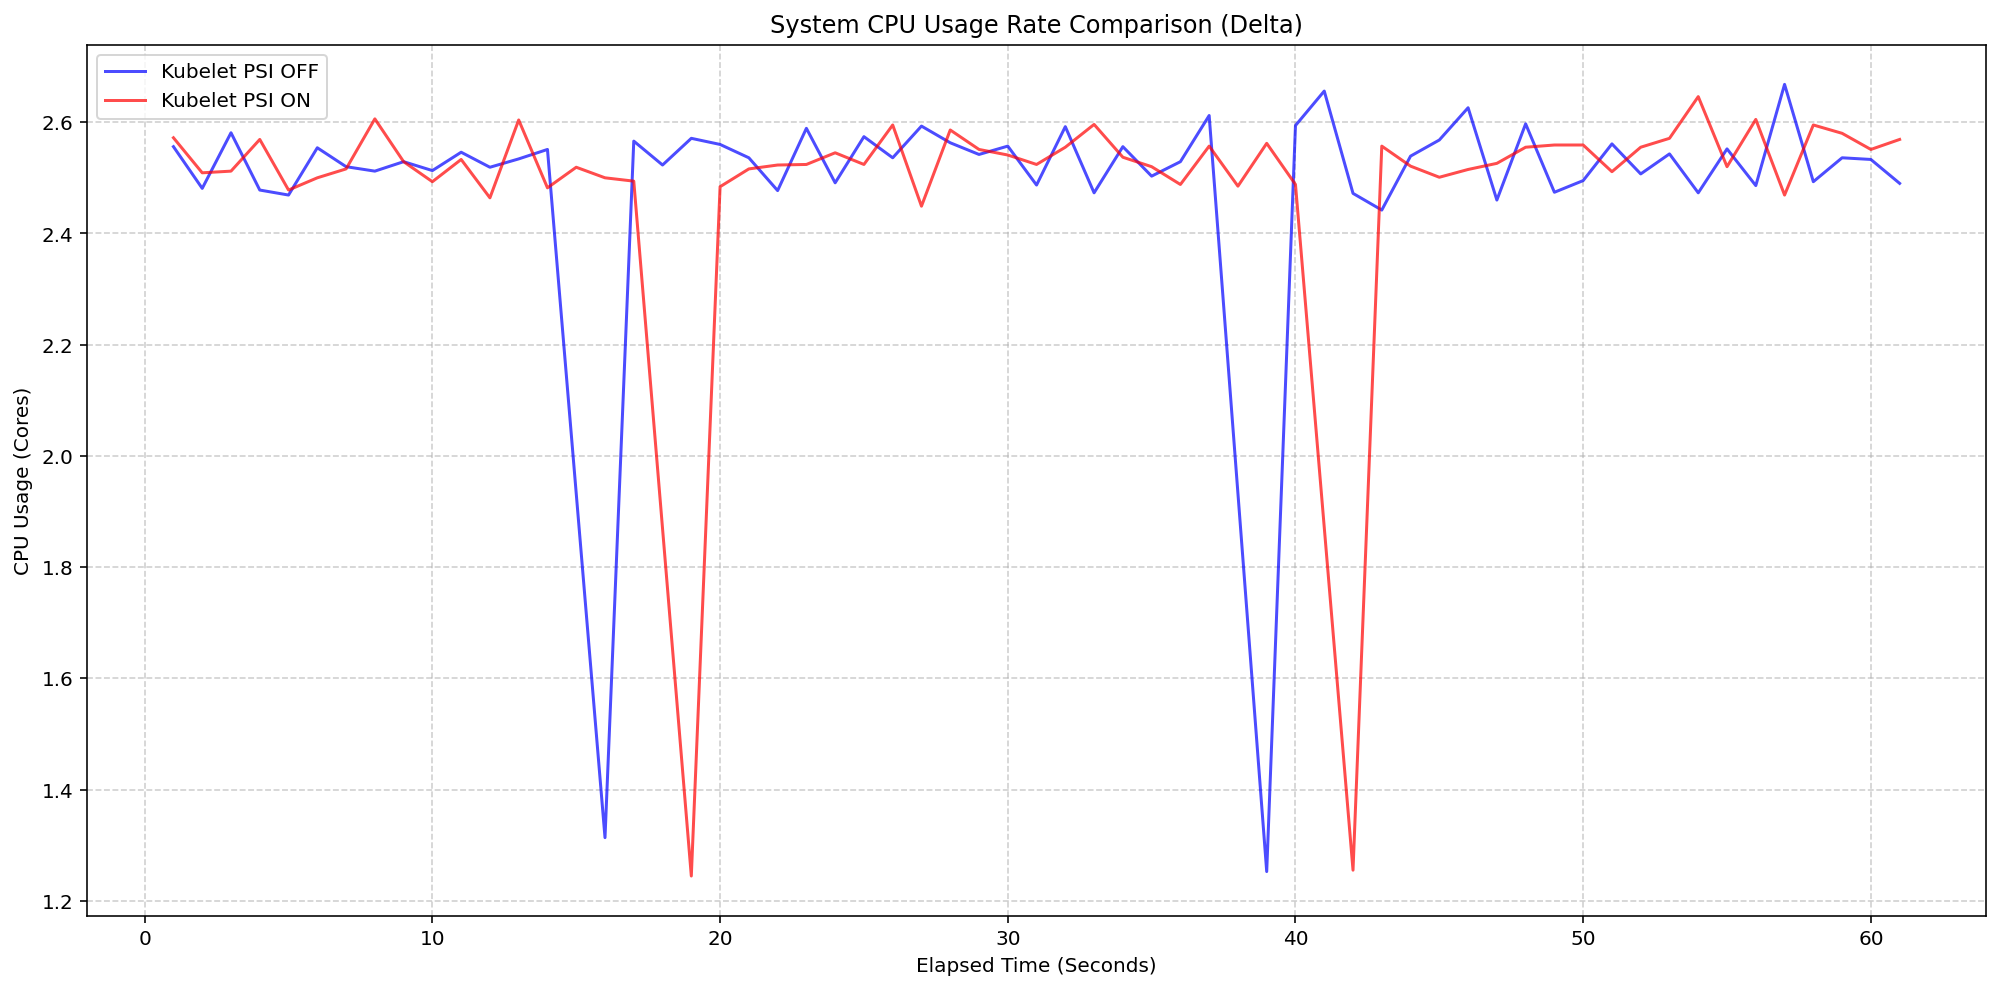
These tests confirm a vital truth for production environments: the granular visibility provided by PSI is "cheap" in terms of compute resources, making it a sustainable addition for even the most resource-constrained nodes.
Official Perspectives: The Impact of GA
The graduation of PSI to General Availability is viewed by the maintainer community as a foundational improvement to the Kubernetes observability stack.
"The transition from simple usage metrics to pressure metrics is the single most important advancement for cluster reliability this year," says a lead maintainer from SIG Node. "By allowing operators to differentiate between ‘busy’ and ‘congested,’ we are reducing the mean time to resolution (MTTR) for complex performance issues that previously took hours of manual debugging to diagnose."
The move to GA also signals to cloud providers and managed Kubernetes vendors that PSI is ready for wide-scale deployment. By standardizing these metrics, the community has ensured that third-party monitoring tools, such as Prometheus, Grafana, and Datadog, can ingest and alert on this data without custom, proprietary hacks.
Implications for Future Operations
The integration of PSI has profound implications for how teams manage production workloads:
- Smarter Auto-scaling: Horizontal Pod Autoscalers (HPA) can now be configured to scale based on actual resource contention rather than just memory or CPU thresholds. This prevents "flapping" and ensures that scaling events occur exactly when performance degradation is detected.
- Improved SLO Management: Service Level Objectives can now be tied to PSI metrics. If a service level target is missed, engineers can check if the underlying node was experiencing I/O or memory pressure, providing an immediate root cause analysis (RCA).
- Better Capacity Planning: By analyzing historical PSI data, platform teams can identify "noisy neighbors"—pods that cause high levels of resource contention for other tasks—and move them to dedicated instance pools.
Getting Started with PSI
As of v1.36, the feature is enabled by default. To begin utilizing these metrics, ensure your nodes are running a Linux kernel that supports PSI. You can scrape the metrics directly from the /metrics/cadvisor endpoint.
For those requiring real-time insights, the Kubelet’s Summary API provides a direct interface. For example, using kubectl to query the Summary API allows administrators to inspect pressure data for specific containers:
CONTAINER_NAME="example-container"
kubectl get --raw "/api/v1/nodes/$(kubectl get nodes -o jsonpath='.items[0].metadata.name')/proxy/stats/summary" |
jq '.pods[].containers[] | select(.name=="'$CONTAINER_NAME'") | name, cpu: .cpu.psi, memory: .memory.psi, io: .io.psi'
(Note: Proxying to the Kubelet is a privileged operation. Ensure that RBAC policies are strictly enforced to prevent unauthorized access.)
Conclusion: A More Transparent Infrastructure
The release of Kubernetes v1.36 marks the end of the "black box" era for resource management. With the inclusion of PSI, the platform provides a transparent, data-driven view into the physical constraints of the hardware. For the operator, this means less guessing, fewer false alarms, and a significantly more resilient infrastructure. As we look toward the future, the integration of PSI will likely serve as the bedrock for the next generation of intelligent, self-healing Kubernetes clusters.