Inside the Engine Room of Open Source: A Deep Dive into Decades of PostgreSQL Development Activity
By [Your Name/Staff Writer]
For the software developer, the daily rhythm of writing, debugging, and compiling code can occasionally become an exercise in cognitive fatigue. When burnout looms, developers often seek refuge in hobbies, reading, or simply stepping away from the keyboard. For Tomas Vondra, a prominent contributor to the PostgreSQL ecosystem, the preferred antidote to coding fatigue is a decidedly analytical form of relaxation: data mining.
Recently taking a break from routine development, Vondra turned his analytical lens toward the inner workings of PostgreSQL itself, pulling decades of historical telemetry to quantify the evolution of one of the world’s most robust and enduring relational database management systems. While long-time contributors often rely on intuition to gauge the health and speed of the project, Vondra’s deep dive translates that intuition into hard statistical realities.
By analyzing two core pillars of the project—the pgsql-hackers mailing list and the project’s central Git repository—Vondra has mapped the growth, shifting bottlenecks, and changing methodologies of the PostgreSQL community from the late 1990s to the modern era.
Main Facts: Quantifying the Scale of PostgreSQL Development
The sheer scale of PostgreSQL’s infrastructure is a testament to its longevity and mission-critical status in modern enterprise architecture. Vondra’s data analysis centers primarily on two archival goldmines: the pgsql-hackers mailing list, which serves as the primary town square for patch submissions and architectural debates, and the official Git repository, which houses the immutable ledger of code committed to the project.
The dataset spans multiple eras of software engineering history. Mailing list archives reach back to 1998, while the Git repository captures history stretching back to 1996—though the earliest years incorporate archives originally imported from CVS.
Key high-level takeaways from the data include:
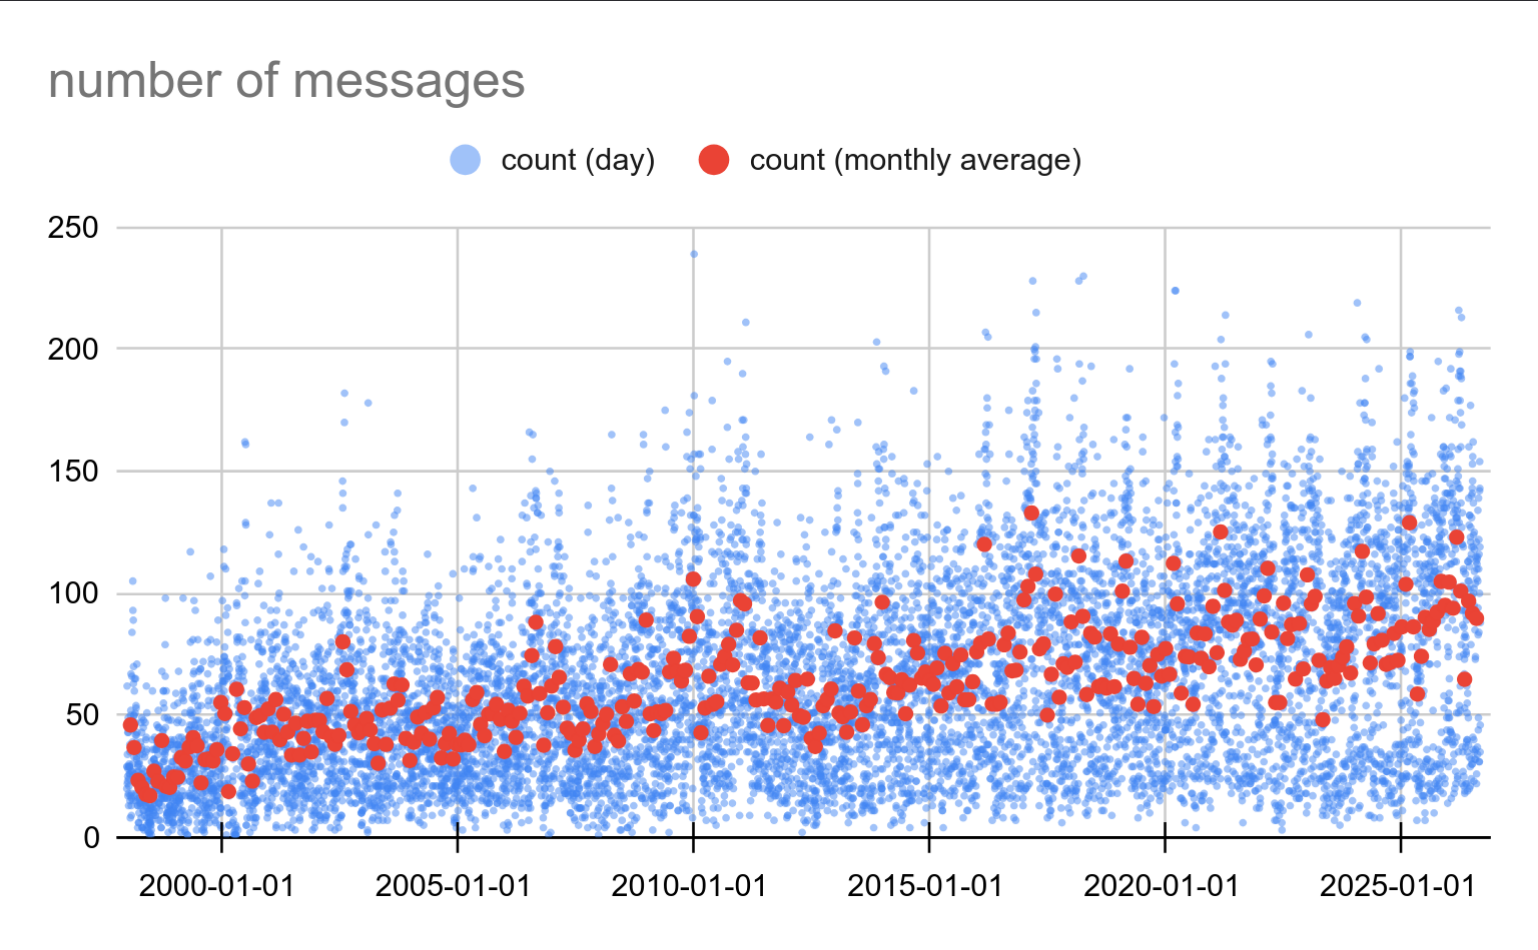
- Explosive Mailing List Growth: Daily message volumes on
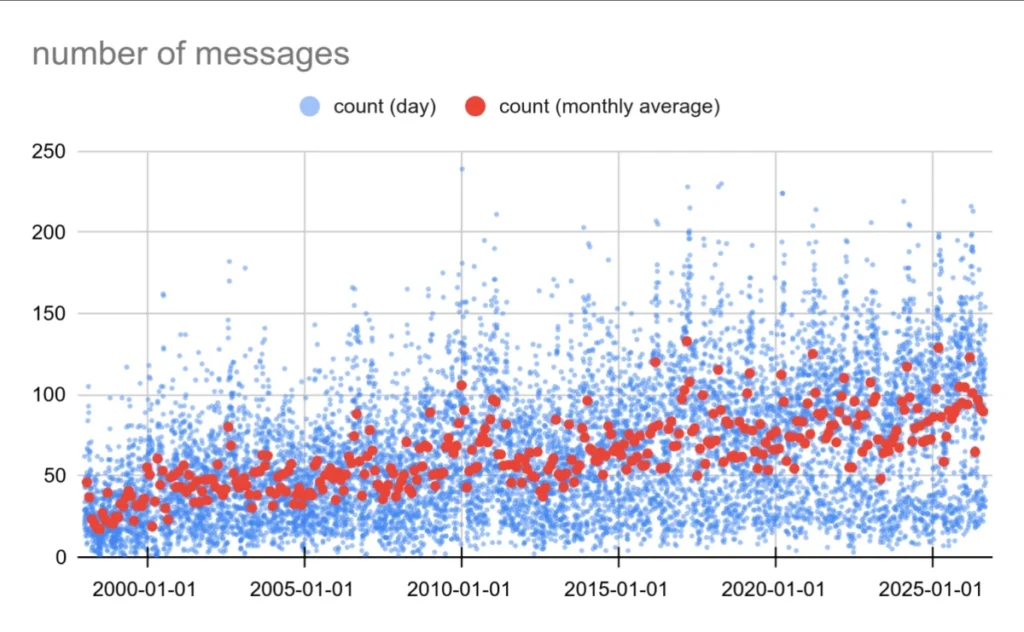
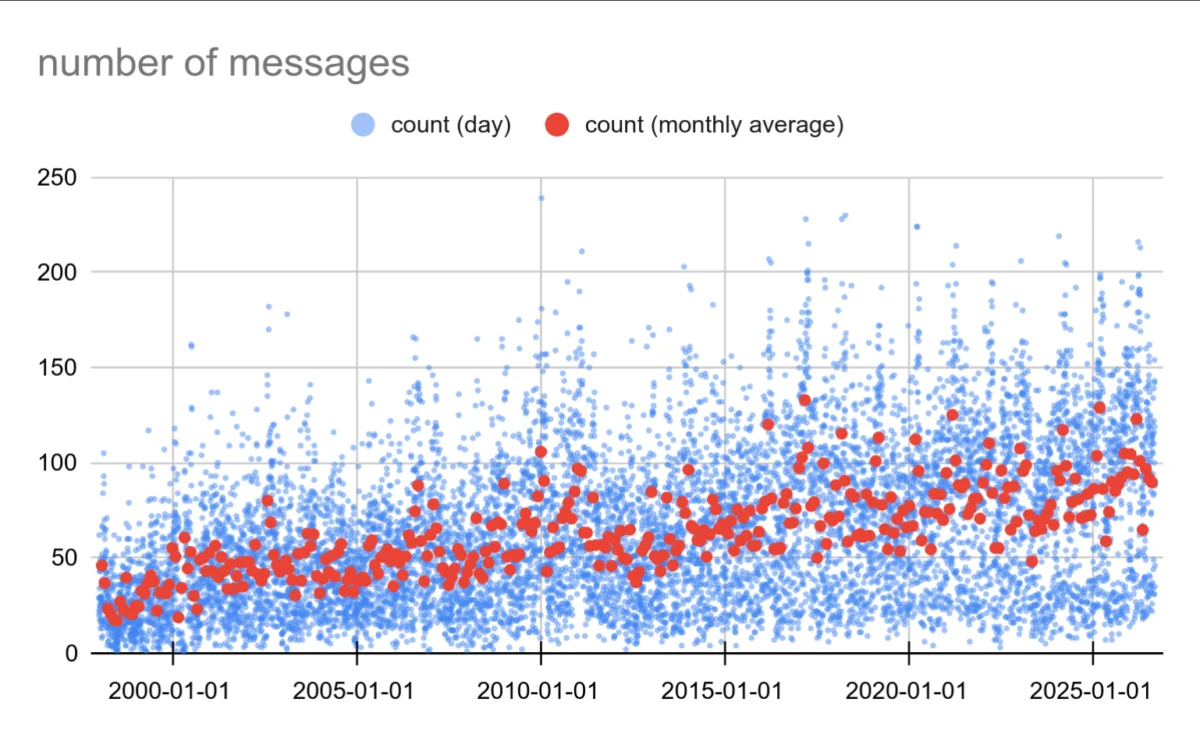
pgsql-hackershave quadrupled from roughly 25 messages per day in the late 1990s to a consistent baseline of 100 messages per day today, with seasonal peaks hitting 200 messages daily. - Expanding Codebases: Between 1996 and 2026, the project has accumulated roughly 4.4 million net new lines of code, documentation, and tests. When counting all structural additions rather than raw net lines, the ecosystem swells past 9 million lines.
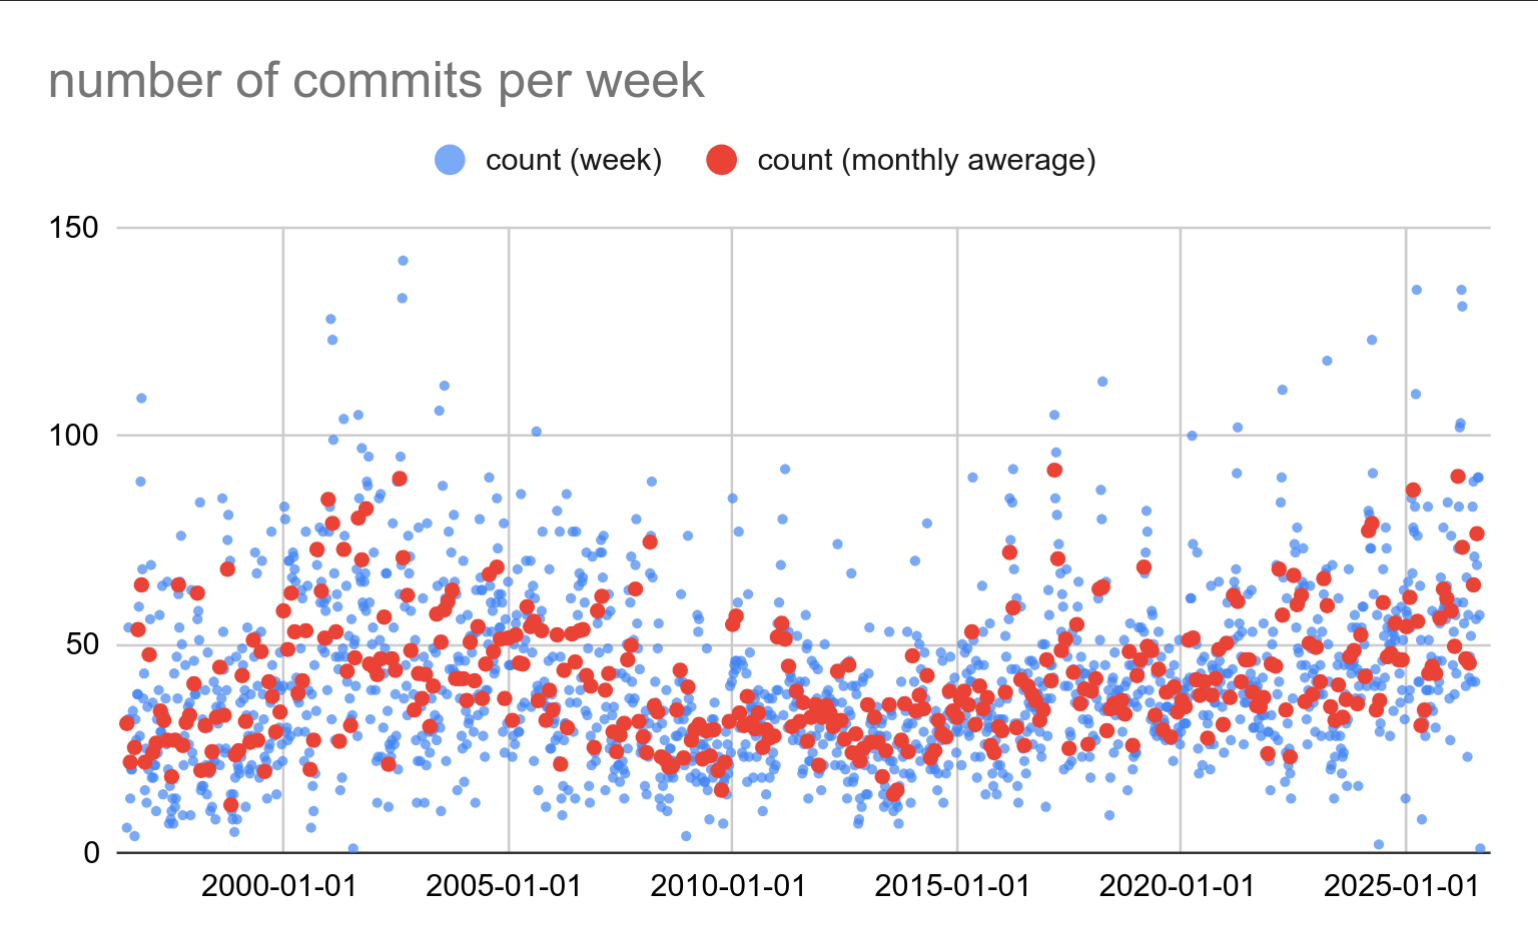
- Commit Velocity: The project averages approximately 50 commits per week, up significantly from a baseline of about 25 commits per week in 2010.
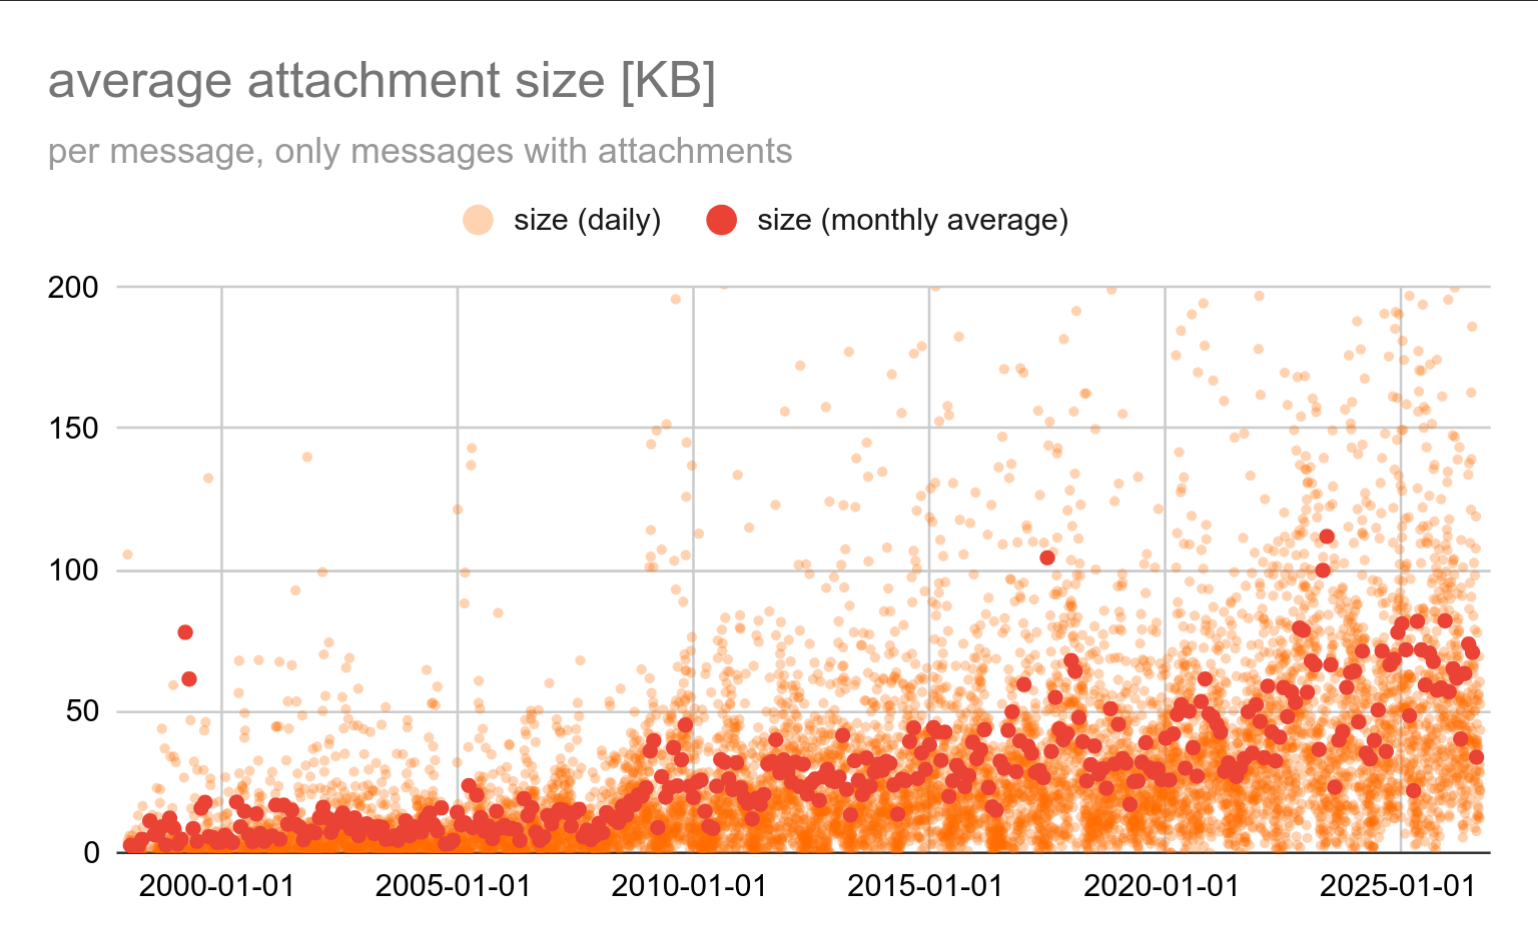
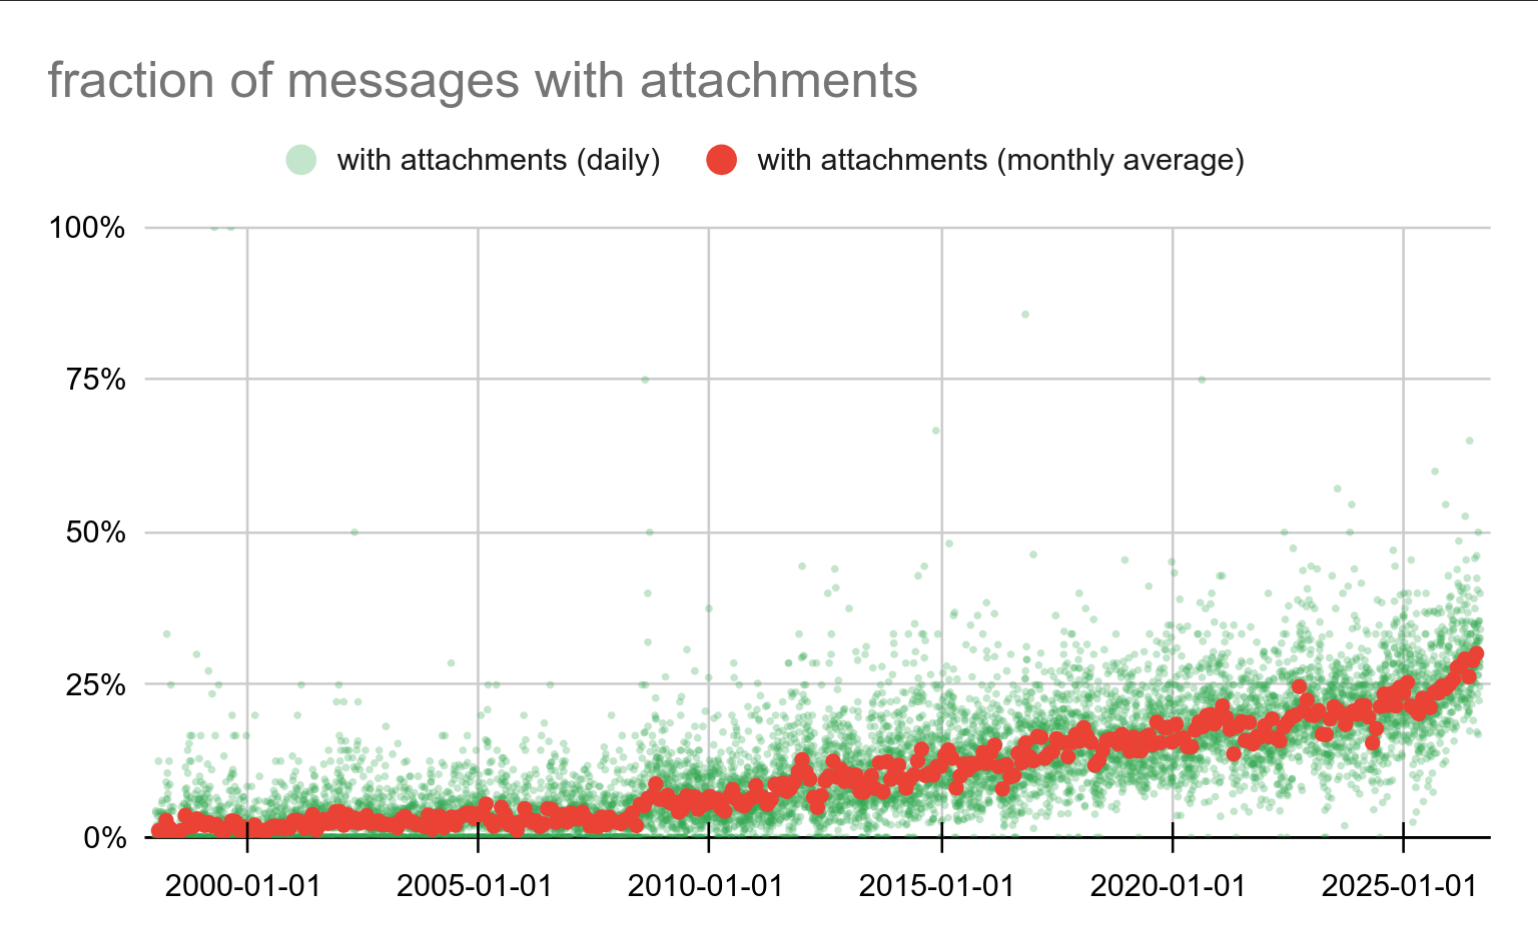
- Patch Complexity: The proportion of mailing list messages containing attachments (typically patches) has jumped from a mere 5% prior to 2008 to roughly 25% today, reflecting a more rigorous, patch-heavy review process.
Chronology: Milestones in Community Evolution and Tooling
To understand how PostgreSQL scaled its development operations, one must view the data chronologically. The project’s history is punctuated by shifts in tooling, organizational structures, and community workflows that directly altered the shape of the data.
The Pre-Commitfest Era (Late 1990s – 2007)
During the late 90s and early 2000s, PostgreSQL operated as a smaller, tightly knit open-source project. Communication was steady, but message volumes were manageable. Commit sizes were erratic, and patch management lacked the formalized structural milestones that define modern open-source governance.
The Turning Point of 2008: Introduction of the Commitfest
A major structural inflection point occurred around 2008, a year that fundamentally reorganized PostgreSQL’s development lifecycle. This period marked the introduction of the "commitfest" concept—a structured mechanism designed to organize, review, and shepherd patches through distinct phases before major releases.
Interestingly, Vondra’s data reveals a sharp, temporary drop in weekly Git commits around early 2008, aligning almost perfectly with the rollout of the first formalized commitfests. By forcing patches through a synchronized review funnel rather than pushing them haphazardly to the repository, the community effectively created a metabolic rhythm for the codebase.
The CVS-to-Git Migration (2010)
In 2010, the project completed its migration from CVS to Git, moving away from legacy version control systems toward a modern distributed architecture. While the direct statistical impact of the migration is difficult to isolate from concurrent community growth, the year 2010 also marked a structural doubling of active committers and a permanent upward trajectory in commit velocity—climbing from 25 weekly commits to the modern standard of 50.
The Modern Era and the Commit Fest App (2015 – Present)
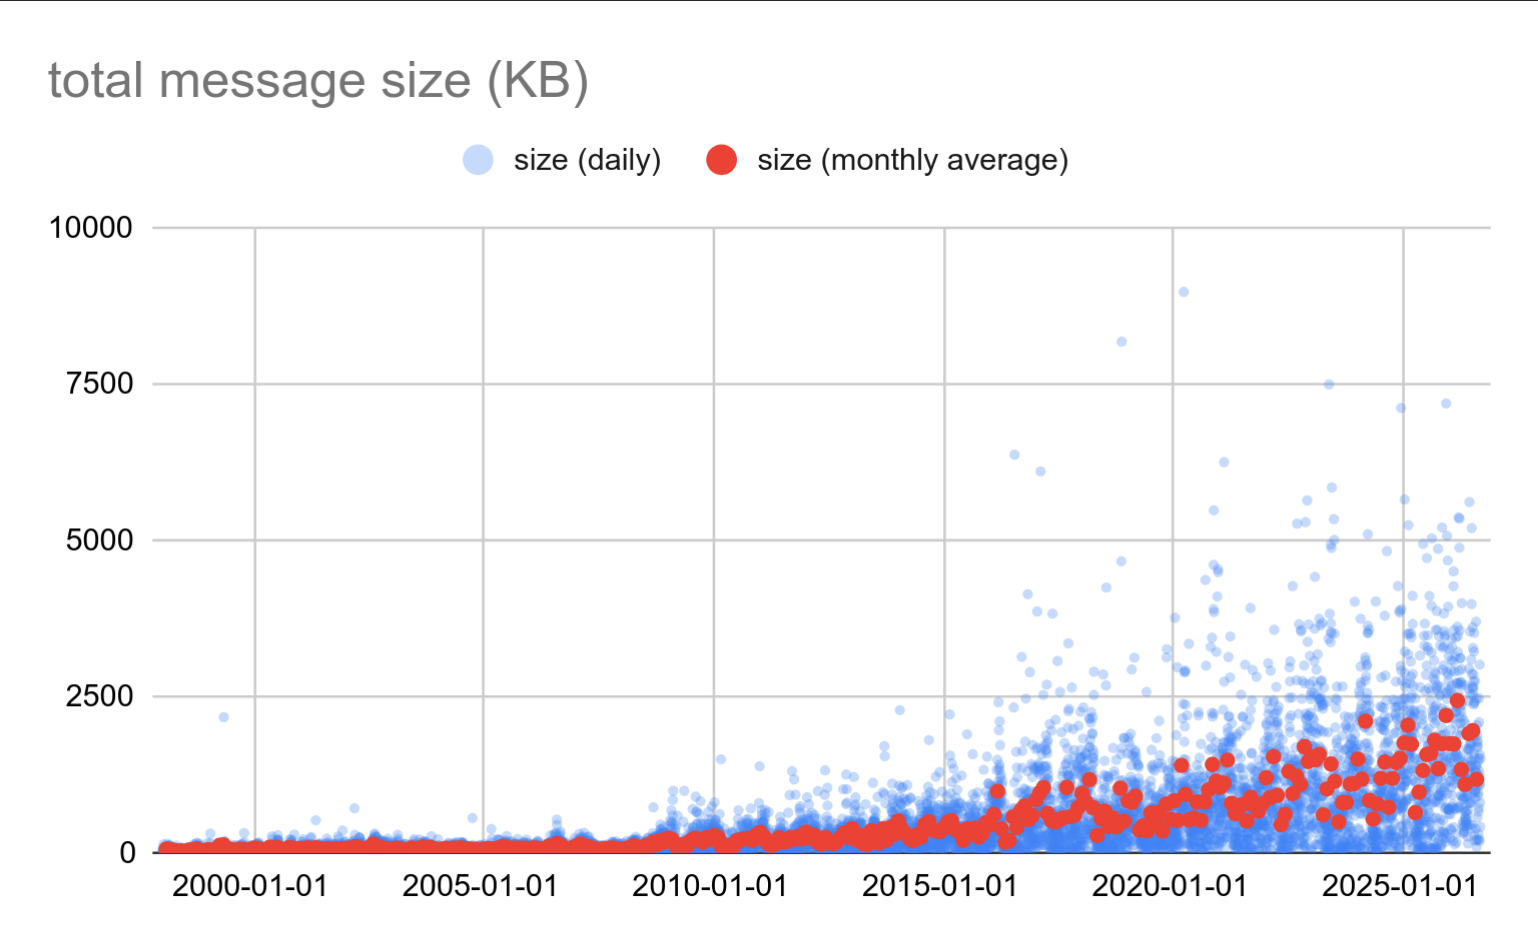
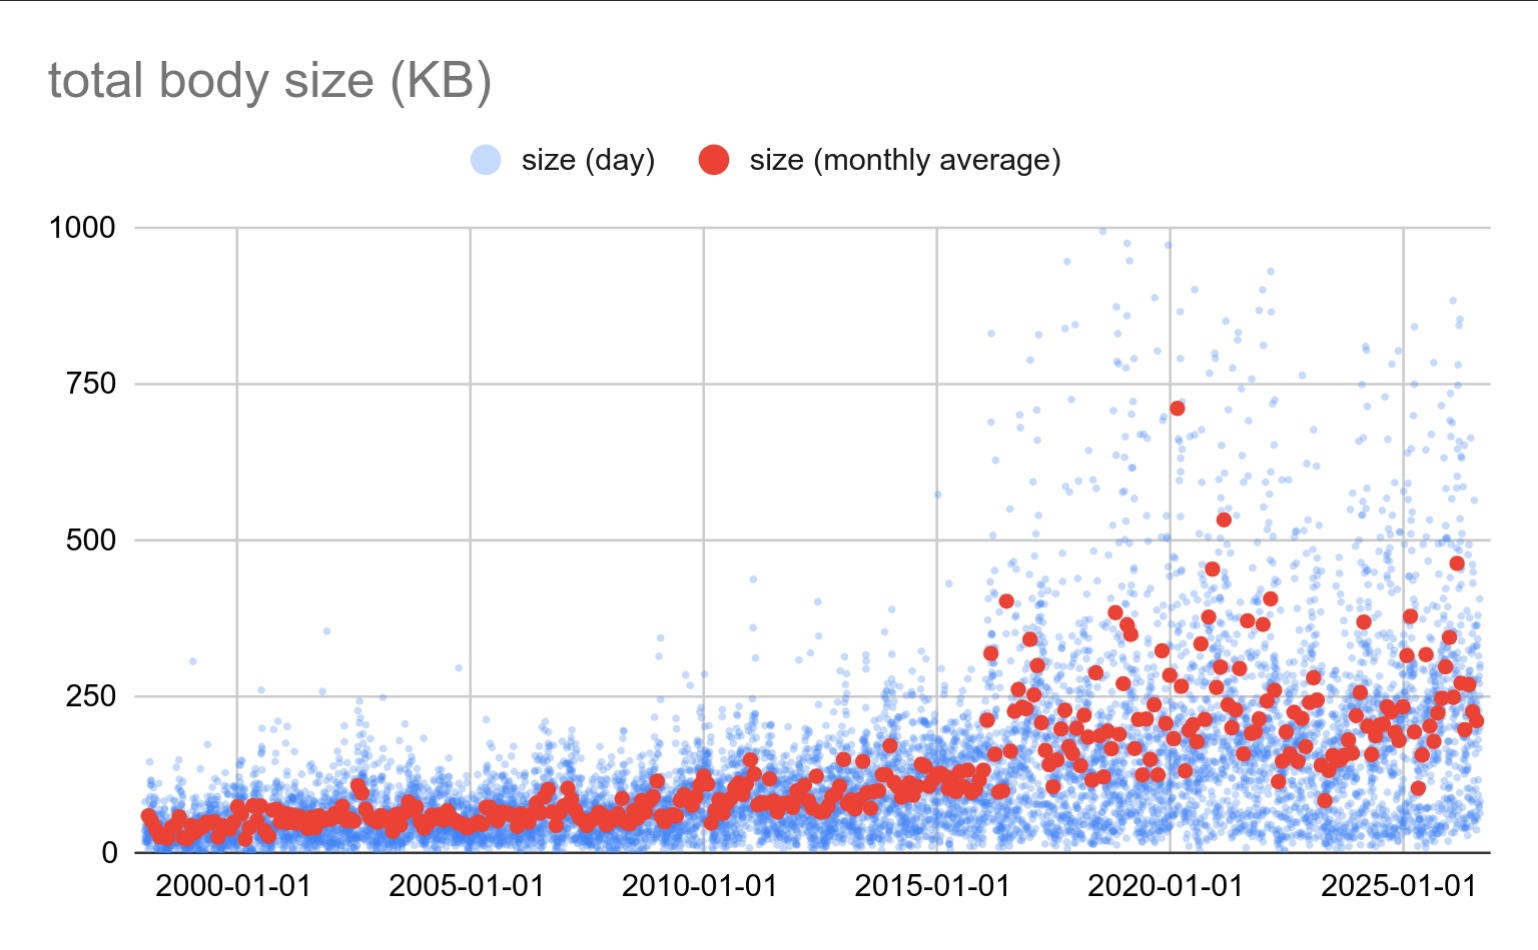
By 2015, the community deployed the dedicated "Commit Fest app," further modernizing patch tracking. Around this same period, mailing list message sizes experienced a massive structural shift. Total message sizes per day leaped from roughly 100kB to 200kB in 2009, and then steadily scaled to a staggering 2MB per day by the mid-2010s. This ballooning data footprint reflects not just a larger user base, but heavier documentation, more expansive test suites, and larger benchmark data attachments shared by contributors.
Supporting Data: Dissecting the Metrics
Vondra’s analysis avoids overly dry tables, relying instead on clean, time-series charts that track the heartbeat of the project across various dimensions.
The Mailing List Bottleneck
The pgsql-hackers mailing list remains the lifeblood of PostgreSQL development, but its sheer volume has created a distinct human bottleneck. Vondra’s per-month and per-day message charts display a clean, consistent upward trend punctuated by predictable annual spikes.
These spikes occur reliably every March, corresponding directly to the frantic weeks right before the feature freeze for each upcoming major database version. During these windows, daily traffic frequently doubles to 200 messages per day.
"Most developers I spoke to agreed it became nearly impossible to follow all the discussions in detail and then also do some actual work," Vondra notes. "There’s just too much happening."
This cognitive overload has placed a premium on communication hygiene. Selecting precise, descriptive subject lines has evolved from a matter of courtesy into a vital survival skill for contributors attempting to filter signal from noise.
Message Size and Attachment Dynamics
While message counts grew linearly, total message size data revealed a fascinating inflection. Up until 2009, daily data transfer on the list remained flat. It then doubled, before entering a prolonged climb that eventually reached 2MB per day.
Filtering out email headers and text bodies to look strictly at raw attachment data shows an even starker trend. The average size of an attachment per message has climbed from roughly 10kB to approximately 80kB. Concurrently, the percentage of mailing list messages containing attachments skyrocketed from 5% pre-2008 to 25% today.
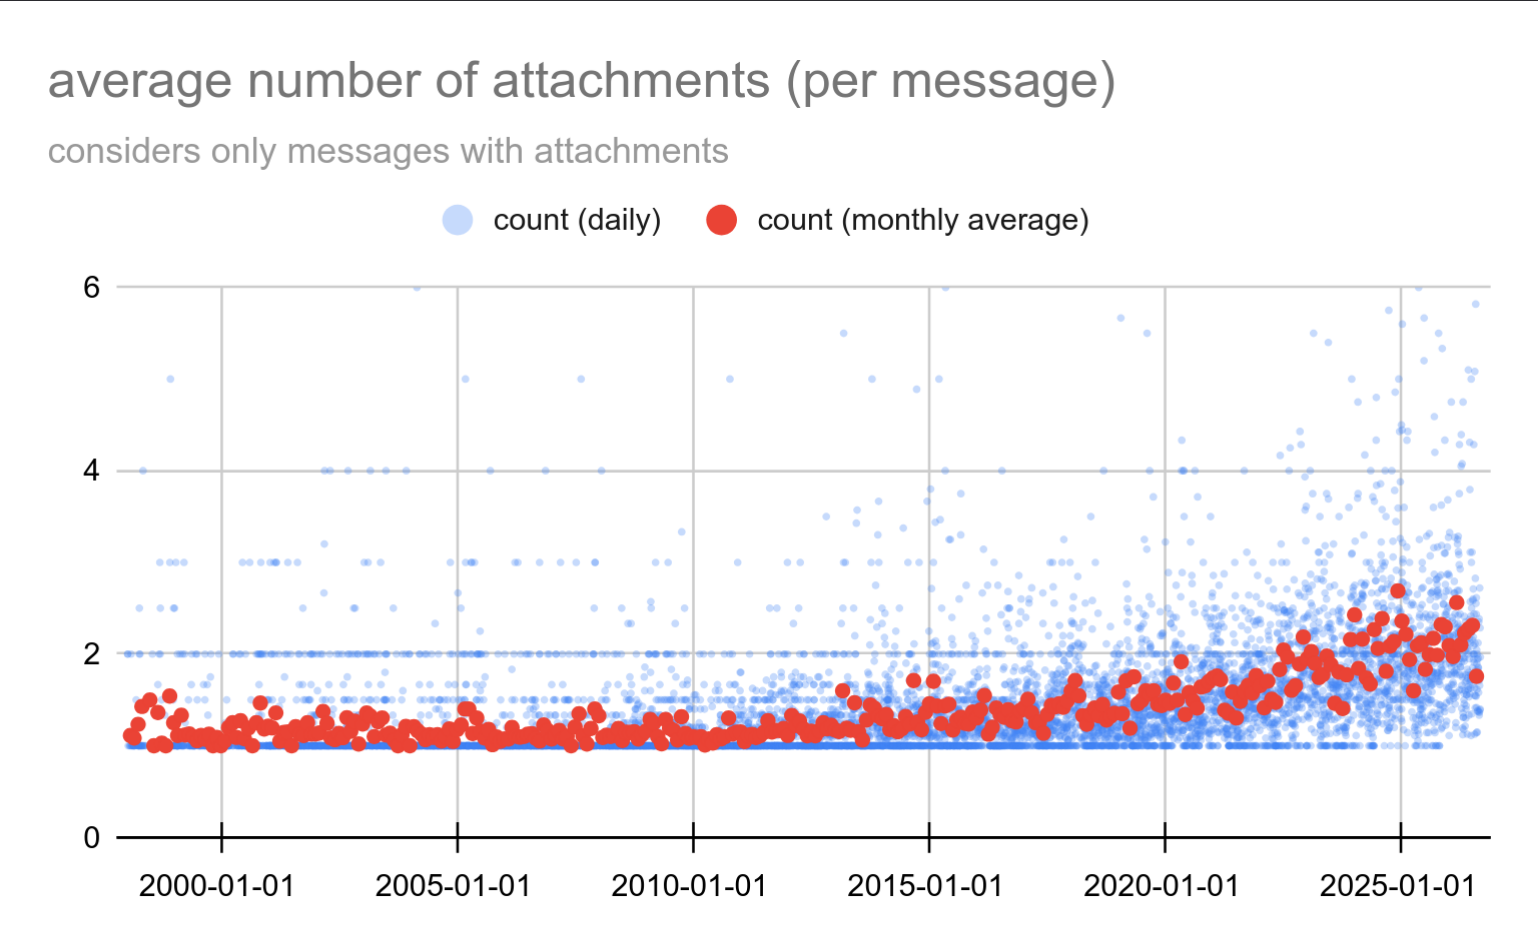
Furthermore, Vondra analyzed patch fragmentation—the number of individual files or parts attached to a single email thread. While the vast majority of patches (~90%) still consist of a single part, and 99% feature fewer than 10 parts, the project exhibits a long tail of highly complex architectural changes. Extreme examples include massive multi-part submissions reaching up to 76 parts. Vondra notes that while intimidating, breaking complex logic into manageable chunks is vastly preferable to reviewing monolithic, un-reviewable code blocks.
Git Commits and Diff Sizes
Turning to the repository level, weekly commit counts paint a picture of steady, sustainable expansion. From roughly 25 commits per week in 2010, the project now regularly executes around 50 commits weekly, mirroring a twofold increase in active committers over the same timeframe.
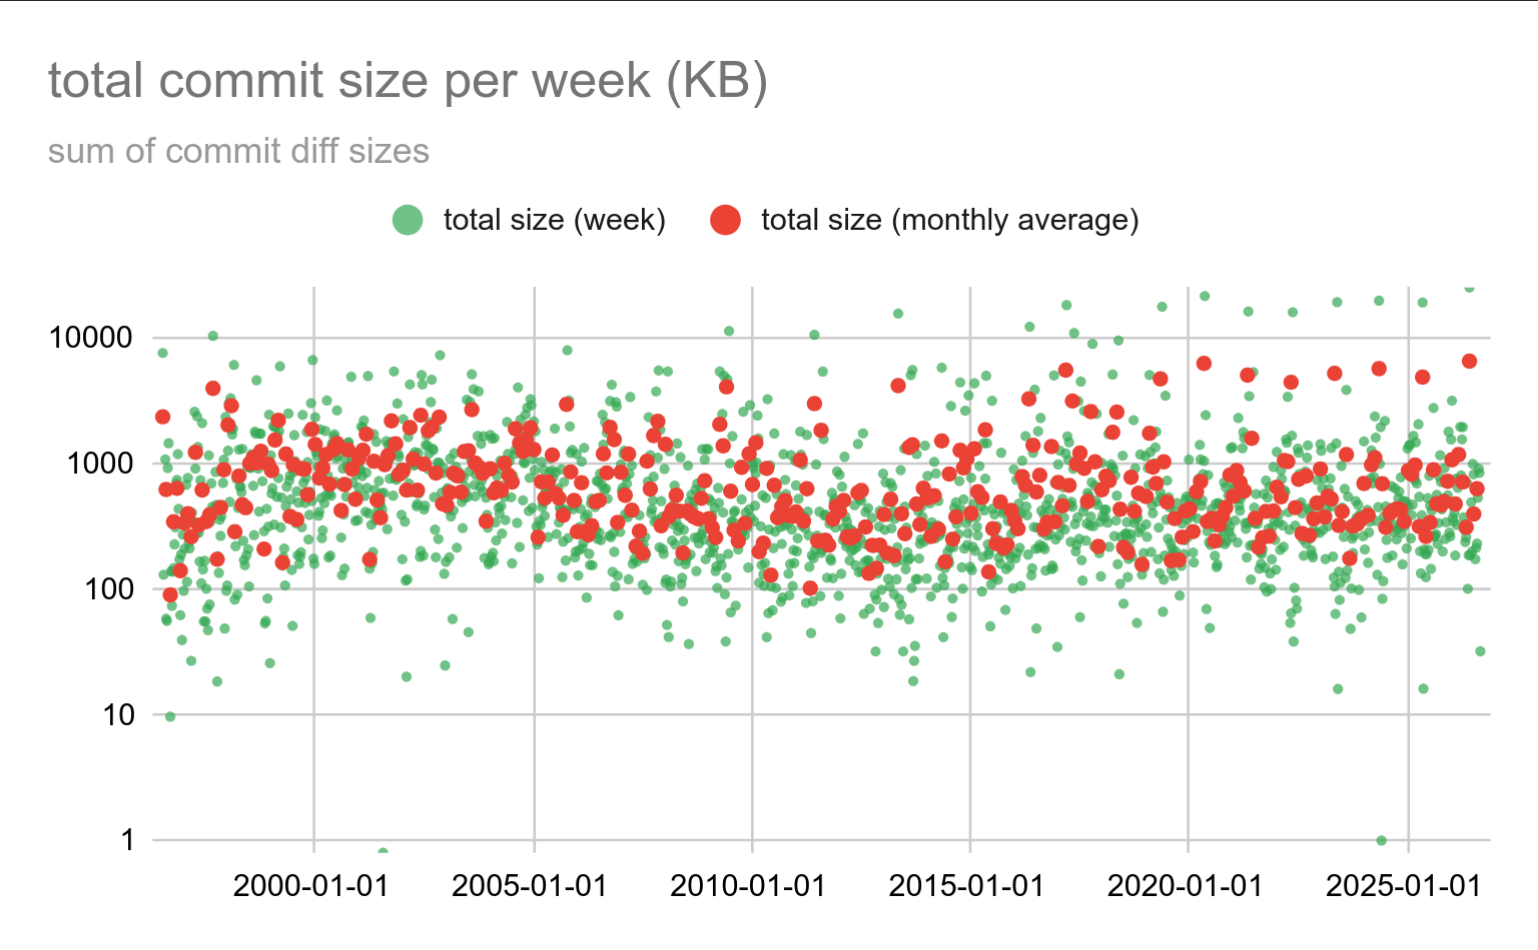
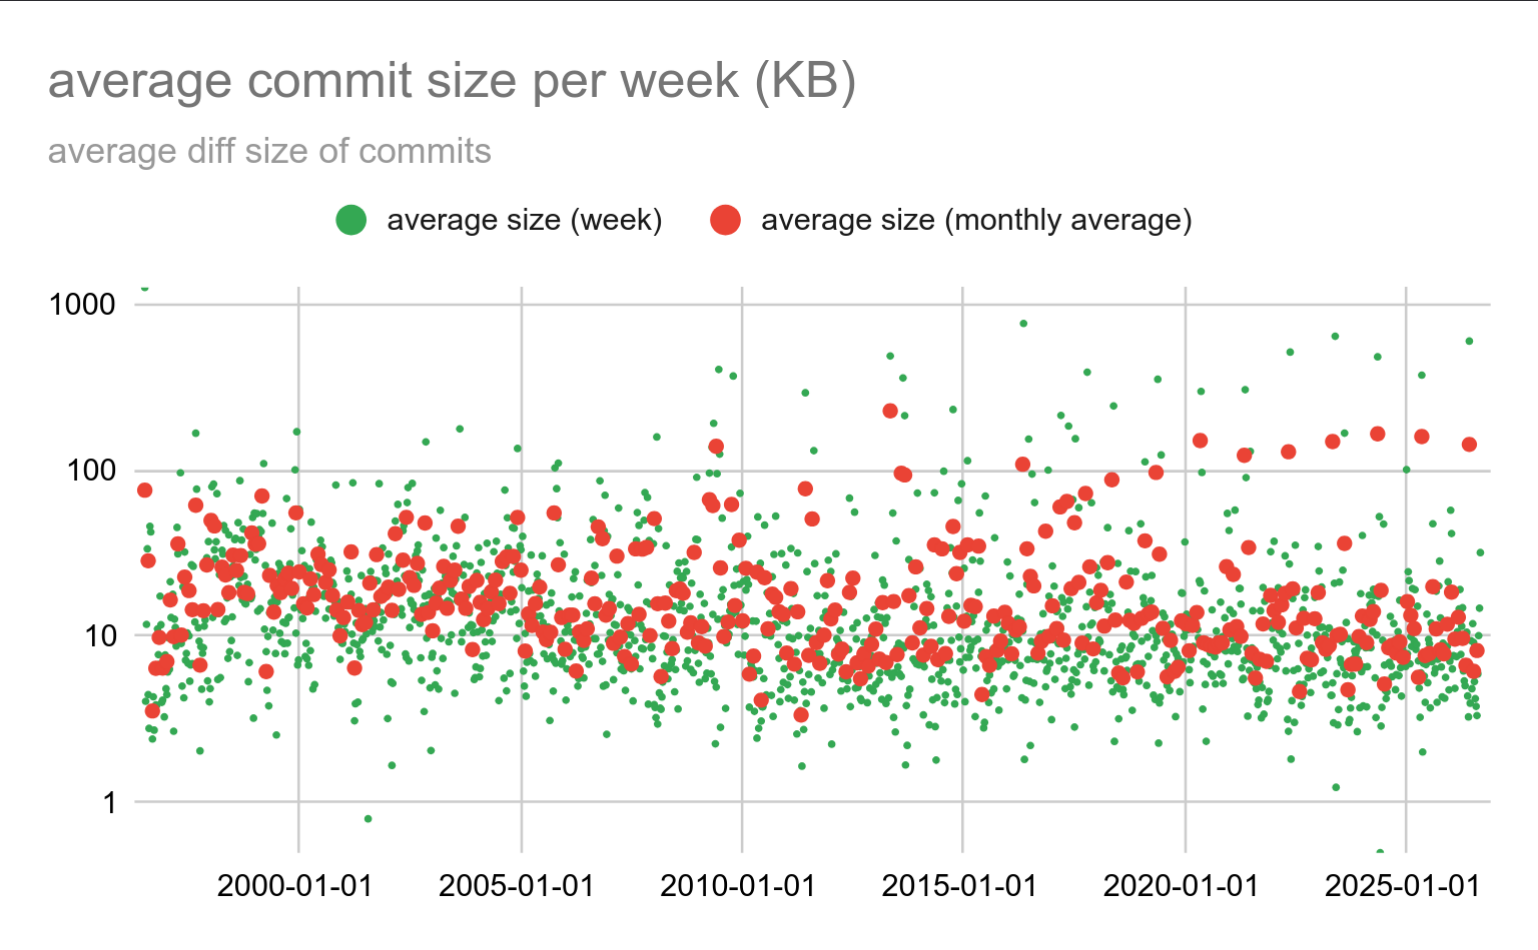
When measuring commit size via diff volume, linear charts break down due to extreme variance, necessitating logarithmic scales. Most weeks see roughly 512kB of modifications landed in the tree. However, regular, predictable anomalies occur precisely once per year in May: massive 20MB weekly commit spikes.
Far from signaling chaotic feature-freeze rushes, these massive spikes represent routine, system-wide updates—such as bulk refreshes of localization and translation files, or historical code formatting passes like pgindent.
Official Responses and Community Impact
While Vondra’s blog post is an independent, exploratory exercise rather than an official organizational whitepaper, its findings have resonated deeply within the broader database engineering community. Core contributors and maintainers have long intuitively understood that the project was scaling faster than any single human could comprehend, but the empirical visualization of that growth provides valuable context for future governance discussions.
Industry observers have noted that PostgreSQL’s ability to scale its human infrastructure—moving from a boutique open-source project to an enterprise-grade global standard backed by major cloud providers and dedicated database companies—is mirrored in these metrics. The structured nature of commitfests and the reliance on heavy mailing list vetting have prevented the project from collapsing under the weight of its own success.
At the same time, the data underscores a growing challenge for open-source sustainability: the "onboarding wall." As mailing list volumes reach 2MB of text and attachments daily, lowering the barrier to entry for new developers becomes increasingly difficult. The data suggests that future improvements in PostgreSQL development efficiency may rely less on raw code output and more on tooling designed to tame communication overhead.
Implications: The Future of PostgreSQL Development
What do decades of development telemetry tell us about the road ahead for PostgreSQL?
First, the data proves that PostgreSQL’s growth is organic, resilient, and structurally managed. The introduction of procedural gates—such as commitfests in 2008—successfully absorbed the shocks of rapid scaling, transforming chaotic developer enthusiasm into a disciplined release cadence.
Second, the project is bumping up against the cognitive limits of human maintainers. When a developer must parse 100 messages a day, sift through 2MB of daily mailing list traffic, and evaluate patches split across dozens of attachments, burnout is an ever-present hazard. The emphasis on clean thread naming, rigorous patch splitting, and automated tooling is no longer optional; it is foundational to the project’s survival.
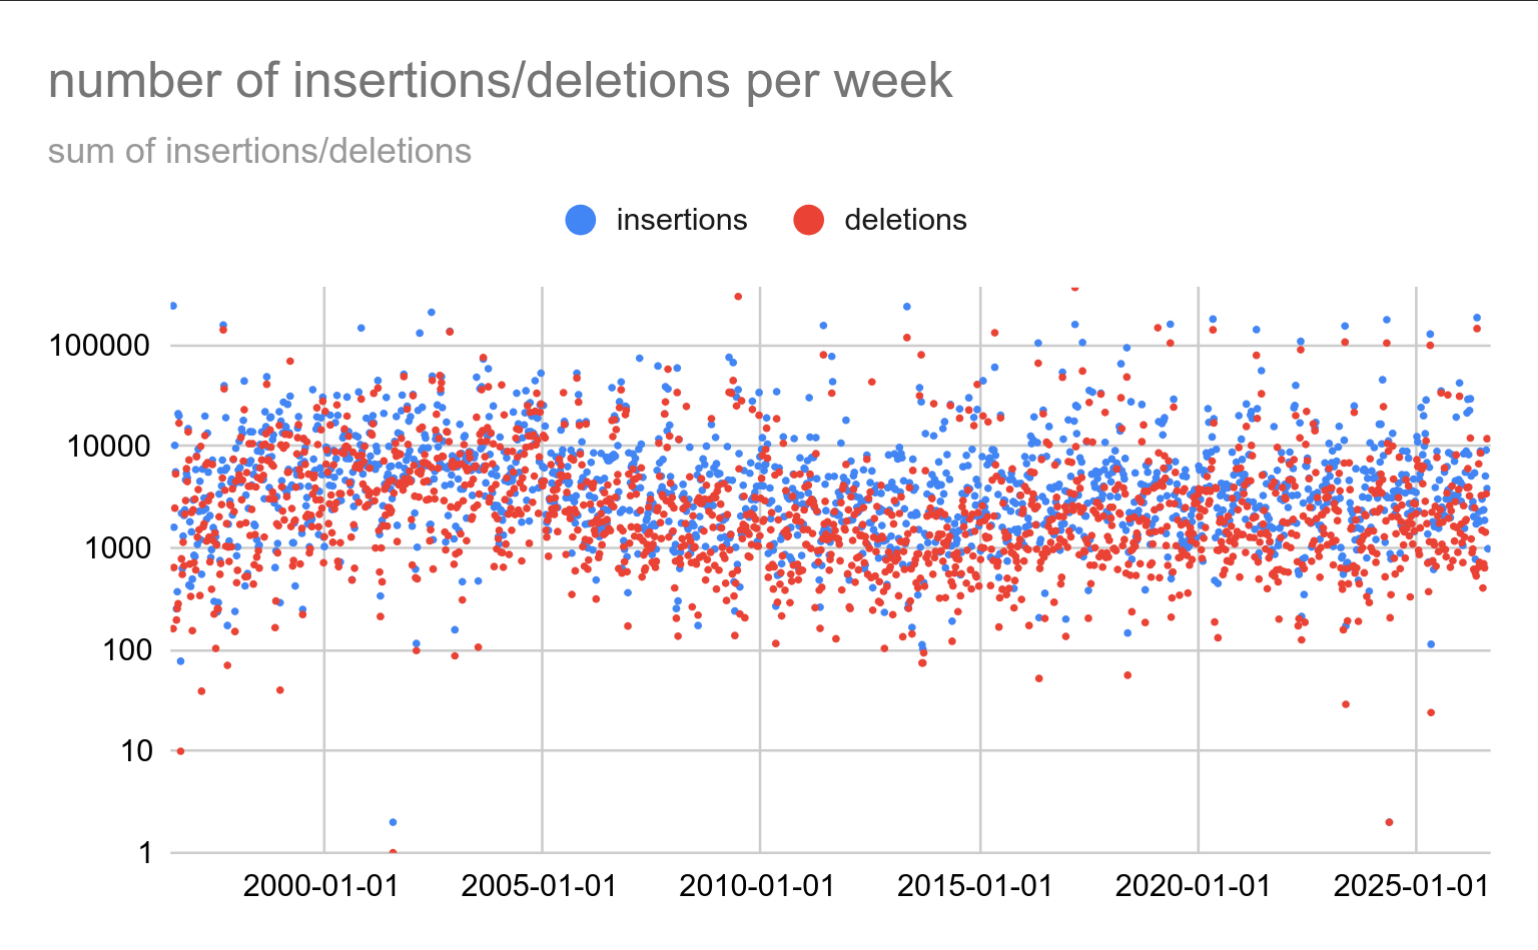
Finally, the numbers demystify what productivity means in a massive open-source project. With over 4.4 million net lines added over three decades—and total infrastructural footprints exceeding 9 million lines—PostgreSQL is an engineering leviathan. Yet, beneath the charts of insertions, deletions, and git diffs lies a human story of thousands of engineers collaborating asynchronously across time zones, bound together by mailing lists, patch files, and a shared dedication to data integrity.
As Vondra humorously concluded his analysis, there are plenty more charts left to generate, but the core message is clear: PostgreSQL is expanding faster, scaling wider, and demanding more coordination than ever before. For an ecosystem powering a vast slice of the modern internet, that is both a triumph of engineering and a warning bell for the future of developer bandwidth.