Engineering Efficiency: How TensorFlow Lite Optimized Memory Management for Edge AI
In the rapidly evolving landscape of machine learning, the deployment of sophisticated models on resource-constrained edge devices—such as smartphones, IoT sensors, and wearables—has become a primary engineering challenge. While TensorFlow Lite (TFLite) has long been the industry standard for high-performance on-device inference, its ability to maintain a lightweight footprint often comes at the cost of runtime overhead.
In a recent technical deep dive, Alan Kelly, a software engineer at Google, unveiled a series of critical performance optimizations targeting the TFLite memory arena. By leveraging advanced profiling tools, the engineering team managed to slash the overhead of memory allocation by half, ensuring that developers can harness the full power of machine learning without sacrificing the responsiveness of their applications.
The Bottleneck: When Memory Management Outpaces Inference
Machine learning deployment is rarely a solitary task; it is typically one component within a much larger, complex software pipeline. TFLite’s memory arena—a system designed to minimize memory usage by strategically sharing buffers between tensors—is a marvel of efficiency. However, as models grow in complexity and utilize dynamic tensors, the logic governing this arena can occasionally become a computational bottleneck.

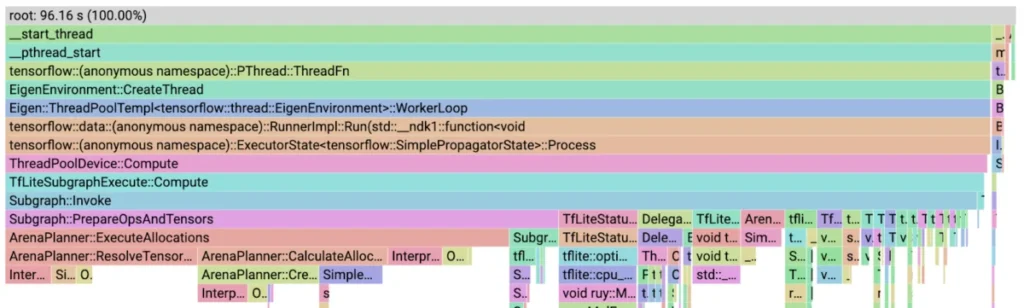
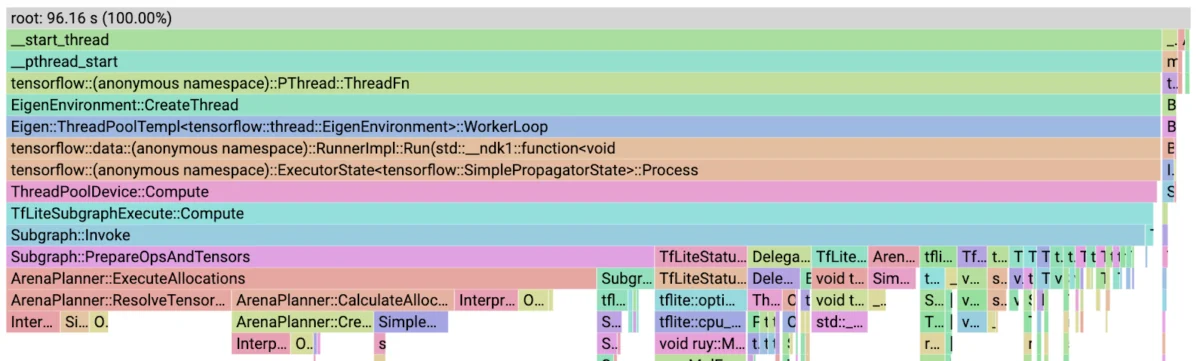
Initially, the engineering team observed that for certain models—particularly those featuring variable input sizes and dynamic tensor outputs—the ArenaPlanner::ExecuteAllocations function consumed upwards of 54% of the total runtime. For developers, this was an alarming statistic: the "plumbing" of the AI model was consuming more resources than the neural network operators (convolutions and fully connected layers) themselves.
A Chronology of Optimization: From Profiling to Performance
The journey to optimization began with a commitment to visibility. To understand why the runtime was struggling, the team turned to Simpleperf, a powerful profiling tool native to the Android NDK.
Phase 1: Diagnosing the Invisible
The team utilized a structured workflow to isolate the inefficiencies:

- Profiling on Device: Using
run_simpleperf_on_device.py, the team recorded the execution of their target binaries directly on the hardware. - Data Extraction: By pulling the
perf.datafile back to a development workstation, they could analyze the call graphs. - Visualization: Leveraging
pprofto generate interactive flame graphs, the team was able to pinpoint exactly which functions were stalling the execution.
Phase 2: Identifying Low-Hanging Fruit
The first major breakthrough came from a counterintuitive discovery: InterpreterInfo::num_tensors() was accounting for over 10% of the total runtime. Because this function was virtual and buried inside a loop, it was being called repeatedly, creating significant overhead. By caching the number of tensors outside the loop, the team eliminated unnecessary function calls.
Similarly, they addressed InterpreterInfo::tensor(unsigned long), another virtual function that performed bounds checking in every iteration. By creating a direct pointer to the underlying tensor array, the team removed the need for repeated, redundant checks. These two seemingly minor refactors resulted in a 25% reduction in overall model runtime.
Phase 3: Streamlining Allocation and Deallocation
With the obvious overheads removed, the team dove deeper into ArenaPlanner. They identified that the logic for determining which tensors were allocated between nodes was inefficient. By pre-mapping the graph structure, they reduced the cost of ArenaPlanner::CreateTensorAllocationVector from 4.8% of runtime to a negligible 0.8%.

Next, they tackled ArenaPlanner::ResolveTensorAllocation. By implementing a change that tracked and updated only the pointers that actually changed, rather than resetting every tensor pointer, they effectively removed this function from the critical path of the profile entirely.
Phase 4: The Data Structure Dilemma
One of the most enlightening moments in the optimization process involved the choice of data structures. The team hypothesized that replacing a std::vector with an std::multimap for storing allocation records might improve performance due to the complexity benefits of tree-based structures.
However, testing revealed that the std::multimap was three times slower than the original std::vector. This served as a vital lesson in systems programming: the constant factors in data structure complexity often outweigh the theoretical asymptotic gains. The team instead opted to optimize the existing vector operations, specifically by replacing expensive std::vector::erase calls with a more efficient std::remove_if approach.

Supporting Data: Impact Metrics
The impact of these changes on TFLite’s performance is significant, particularly for complex models.
| Metric | Pre-Optimization | Post-Optimization |
|---|---|---|
ArenaPlanner::ExecuteAllocations |
~54% of runtime | ~6% of runtime |
ArenaPlanner::CreateTensorAllocationVector |
4.8% of runtime | 0.8% of runtime |
ArenaPlanner::ResolveTensorAllocation |
10.9% of runtime | Negligible |
| Total Allocation Overhead | ~49.9% | ~11% |
These metrics confirm that by refining the memory arena, the team successfully shifted the runtime burden away from the memory management system and back toward the neural network operators, which is the desired outcome for any inference engine.
Official Perspective: Engineering Philosophy
In his report, Alan Kelly emphasized that these improvements were not just about code cleanup; they were about a fundamental change in how the TFLite runtime views its lifecycle. "Efficient use of memory comes at the cost of increased overhead," Kelly noted. "The goal of our optimization was not to remove that cost entirely, but to minimize the constant factors that inflate it."

The team’s approach underscores a "data-first" engineering philosophy. By relying on profiling tools like Simpleperf, the developers were able to challenge their own assumptions about where performance bottlenecks existed. Often, the code that engineers expect to be slow is not the code that is actually hindering performance.
Implications for the AI Ecosystem
The implications of these optimizations for the broader developer community are profound:
- Accessibility for Smaller Devices: By reducing the CPU cycles required for memory management, TFLite becomes even more viable on low-power microcontrollers and budget-tier smartphones.
- Improved User Experience: For end-users, this translates to faster model inference, lower battery consumption, and reduced thermal throttling during AI-intensive tasks like real-time image processing or natural language translation.
- Standardization of Profiling: The transparency regarding the use of
Simpleperfandpprofprovides a blueprint for other AI engineers to follow. It encourages a culture of rigorous performance auditing rather than relying on guesswork. - Integration in TensorFlow 2.13: All of these optimizations have been merged into the official codebase, meaning that developers using TensorFlow 2.13 and later will automatically benefit from these enhancements without needing to change their existing codebases.
Future Outlook
The success of this project serves as a reminder that runtime efficiency is a continuous process. As models become more dynamic and hardware architectures more diverse, the "memory arena" of any inference engine will require ongoing scrutiny.

For developers looking to replicate these results in their own pipelines, the takeaway is clear: use the tools at your disposal to profile early and often. Whether it is caching loop variables, refining data structure choices, or optimizing deallocation logic, the path to a high-performance pipeline is often paved with small, incremental changes that, when aggregated, yield transformative results.
The optimized memory arena is now available, marking a new chapter in the efficiency of on-device machine learning. As the industry continues to push the boundaries of what is possible on the edge, these foundational improvements ensure that TensorFlow Lite remains at the forefront of the AI revolution.