Kubernetes v1.36: Achieving Observability Maturity with Production-Ready Pressure Stall Information (PSI)
By Maria Fernanda Romano Silva (Google Cloud)
Tuesday, May 12, 2026
In the complex orchestration landscape of modern cloud-native computing, the "black box" nature of resource contention has long been a source of anxiety for site reliability engineers (SREs) and platform architects. For years, teams have relied on utilization metrics—CPU and memory usage percentages—to gauge the health of their clusters. However, as the Linux kernel community discovered years ago, utilization is a lagging indicator of performance.
With the official release of Kubernetes v1.36, the platform reaches a new milestone in observability: the General Availability (GA) of Pressure Stall Information (PSI). By providing high-fidelity, actionable signals regarding resource starvation, PSI shifts the paradigm from "how much of the resource is used" to "how much are the tasks actually suffering."
The Core Problem: Why Utilization Metrics Fail
Traditional metrics are often misleading. A node reporting 85% CPU utilization might be functioning perfectly, or it might be experiencing catastrophic task scheduling delays that cause application latency to skyrocket. Utilization tells you what is happening to the resource, but it does not tell you what is happening to the application.
Pressure Stall Information (PSI), originally introduced into the Linux kernel in 2018, fills this critical visibility gap. PSI tracks the time that tasks spend waiting for a resource—CPU, memory, or I/O—that is currently unavailable. By measuring these "stalls" as percentages of time, PSI provides a quantifiable, standardized metric that correlates directly to end-user experience.
In Kubernetes v1.36, this data is now exposed natively at the node, pod, and container levels, allowing operators to identify bottlenecks long before they manifest as outages.
A Chronology of Progress: From Alpha to GA
The journey to integrate PSI into the Kubernetes ecosystem has been a rigorous, multi-year process led by the Kubernetes Special Interest Group (SIG) Node.
- 2018: The Linux kernel introduces PSI, offering a new standard for tracking resource contention.
- v1.33 (Alpha): SIG Node introduces the initial integration, allowing early adopters to experiment with collecting PSI metrics via the Kubelet.
- v1.34 (Beta): The feature matures, with refined interfaces and improved performance overhead, signaling readiness for broader testing.
- v1.36 (General Availability): After extensive performance validation and community feedback, PSI is now stable and enabled by default, requiring no additional feature flags.
This measured approach allowed the project maintainers to ensure that the collection of these metrics did not introduce unwanted latency into the Kubelet, the very component responsible for maintaining the health of the cluster.
Proving Stability: Performance Testing at Scale
A primary concern when graduating any telemetry feature is the "observer effect"—the risk that the act of monitoring the system consumes enough resources to degrade the performance of the system itself. To address this, SIG Node conducted exhaustive performance validation under high-density scenarios, testing nodes with 80+ pods.
Scenario 1: The Kubelet Overhead
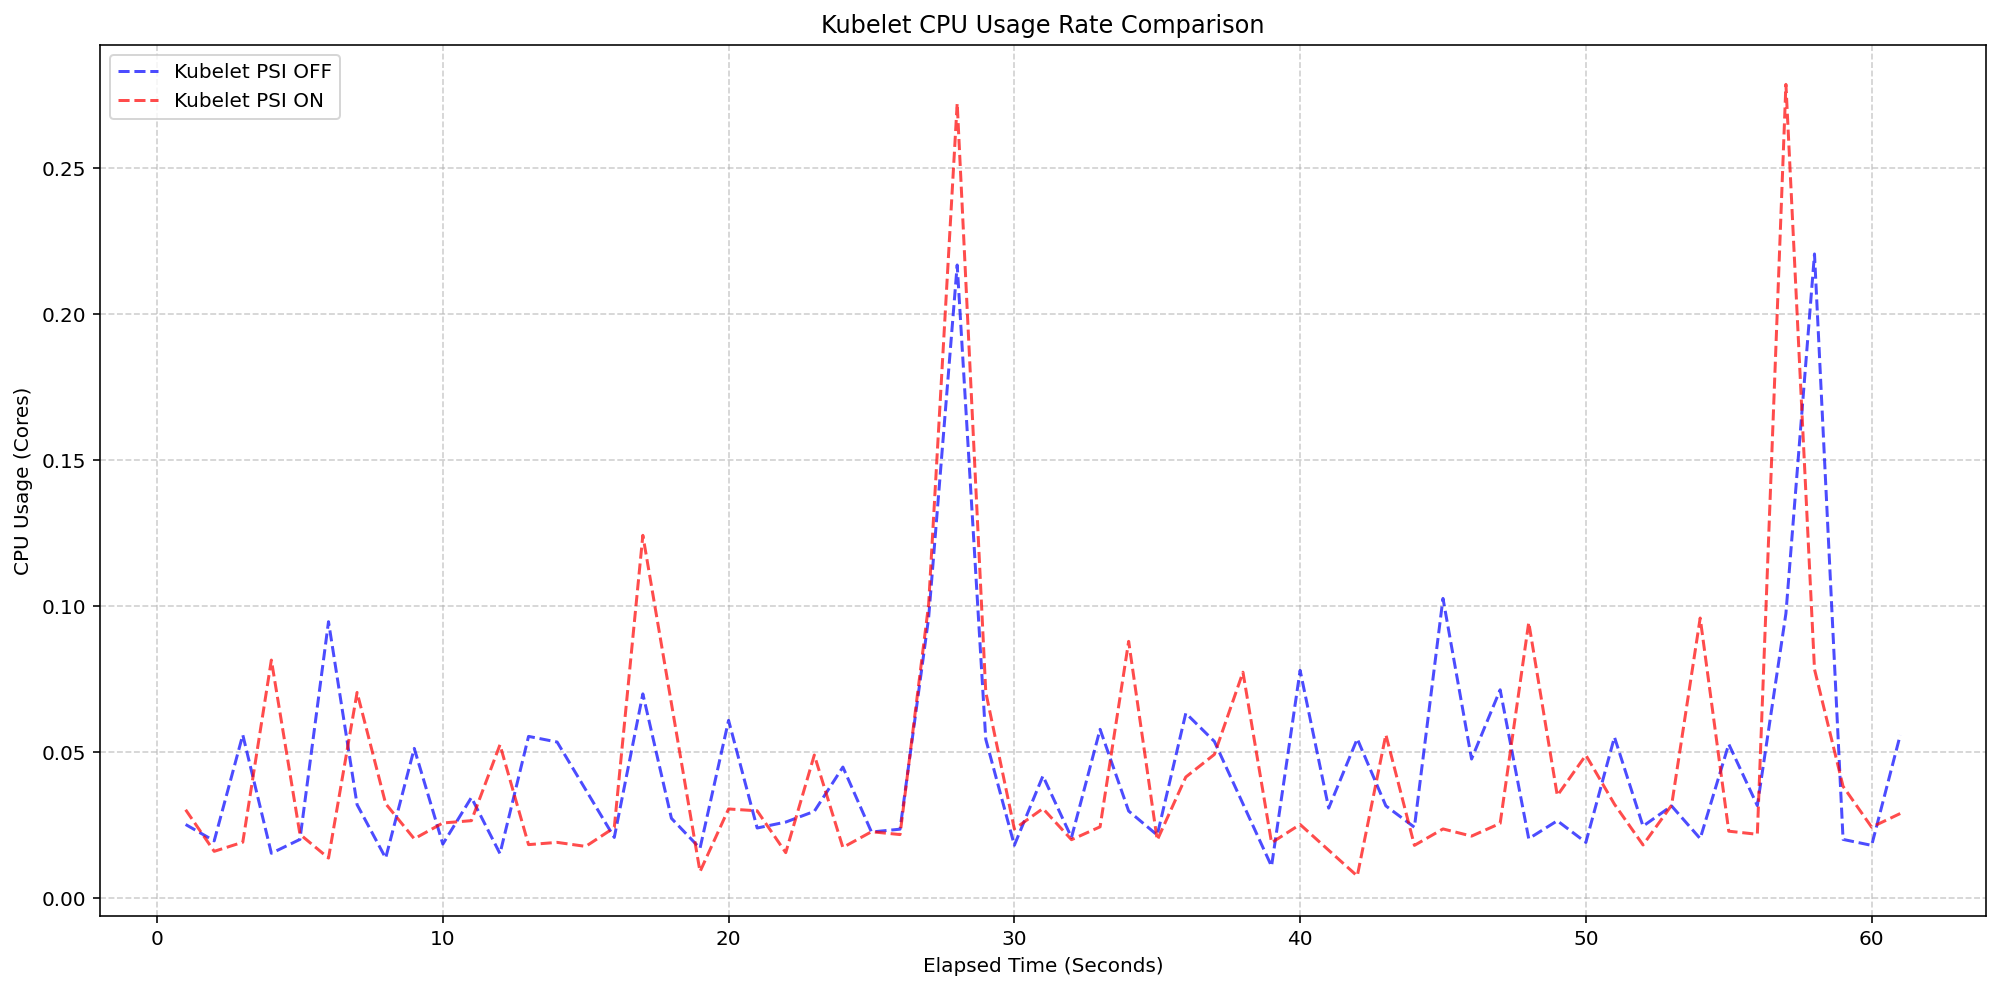
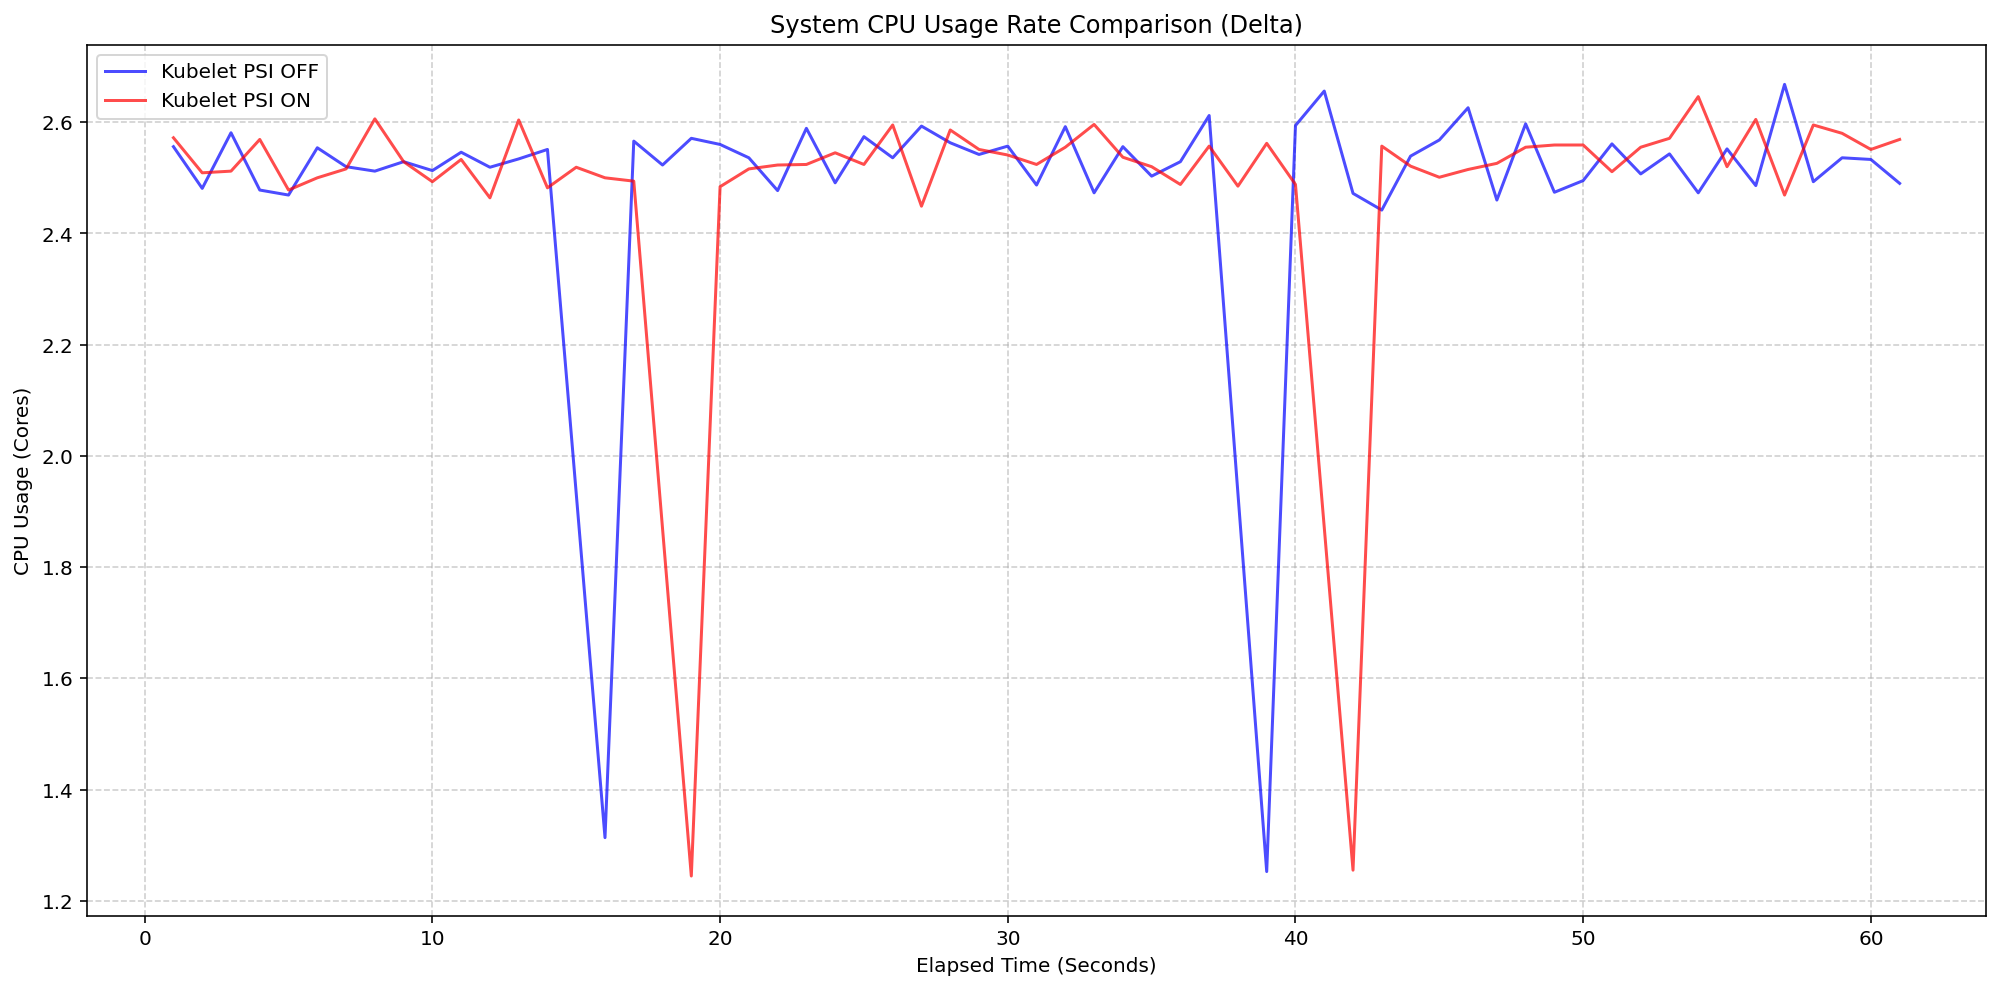
The first phase of testing examined the impact of the Kubelet actively querying and exposing PSI metrics. By comparing clusters with the KubeletPSI feature gate toggled on versus off, engineers sought to isolate the cost of the collection logic.
The results were decisive. Data showed that the Kubelet’s resource consumption remained consistent with baseline levels, consuming roughly 0.1 cores—or approximately 2.5% of total node capacity. The synchronized bursts observed in CPU usage graphs were identical regardless of whether PSI was enabled, confirming that the Kubelet’s collection logic integrates seamlessly into existing housekeeping cycles.
Scenario 2: The Kernel Overhead
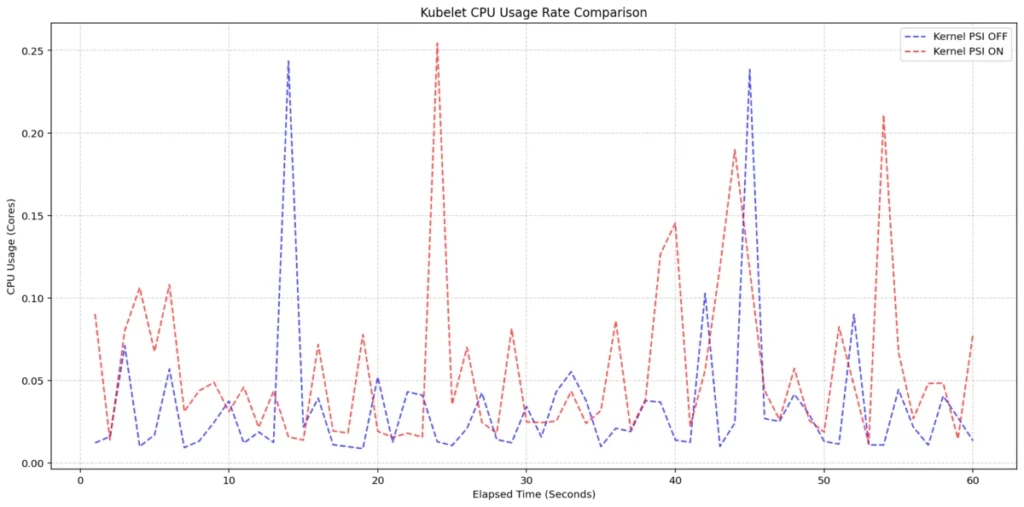
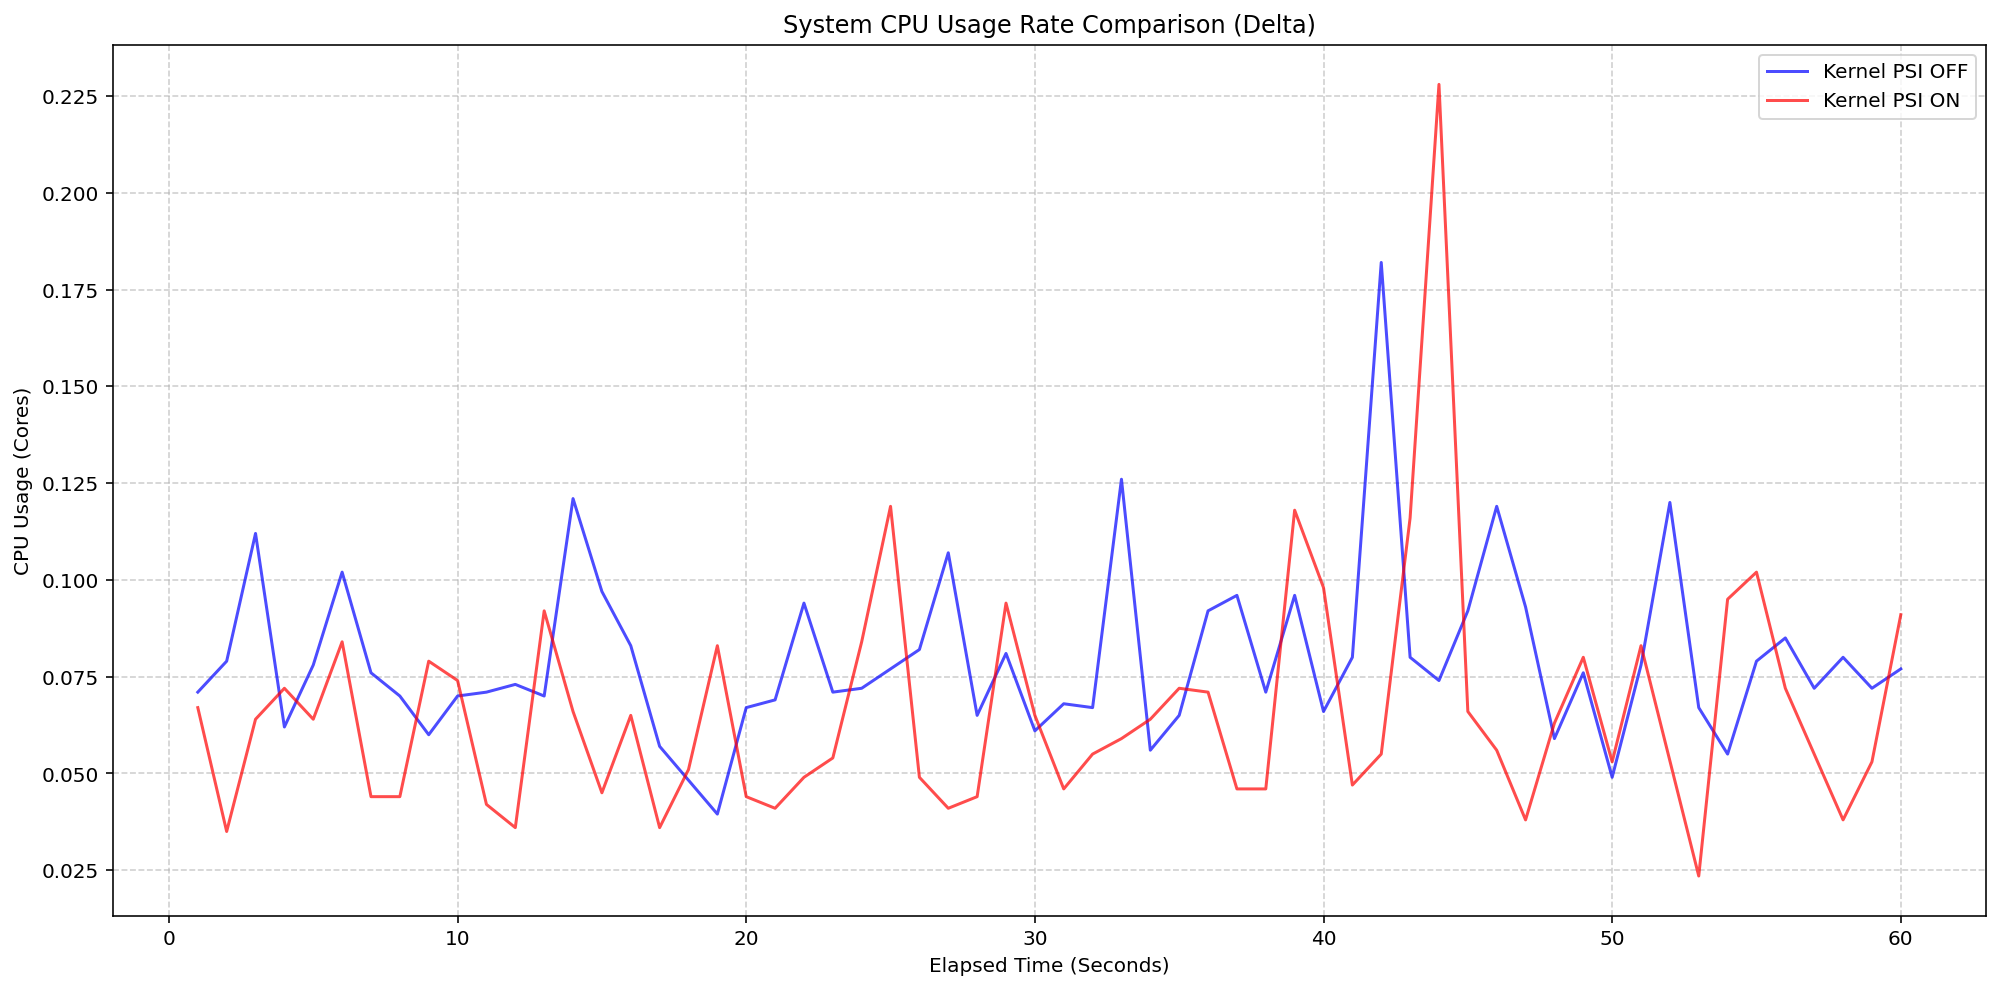
The second phase shifted the focus to the Linux kernel’s bookkeeping. By comparing clusters with kernel PSI enabled (psi=1) against those where it was disabled (psi=0), the team measured the inherent cost of the OS tracking these pressure signals.
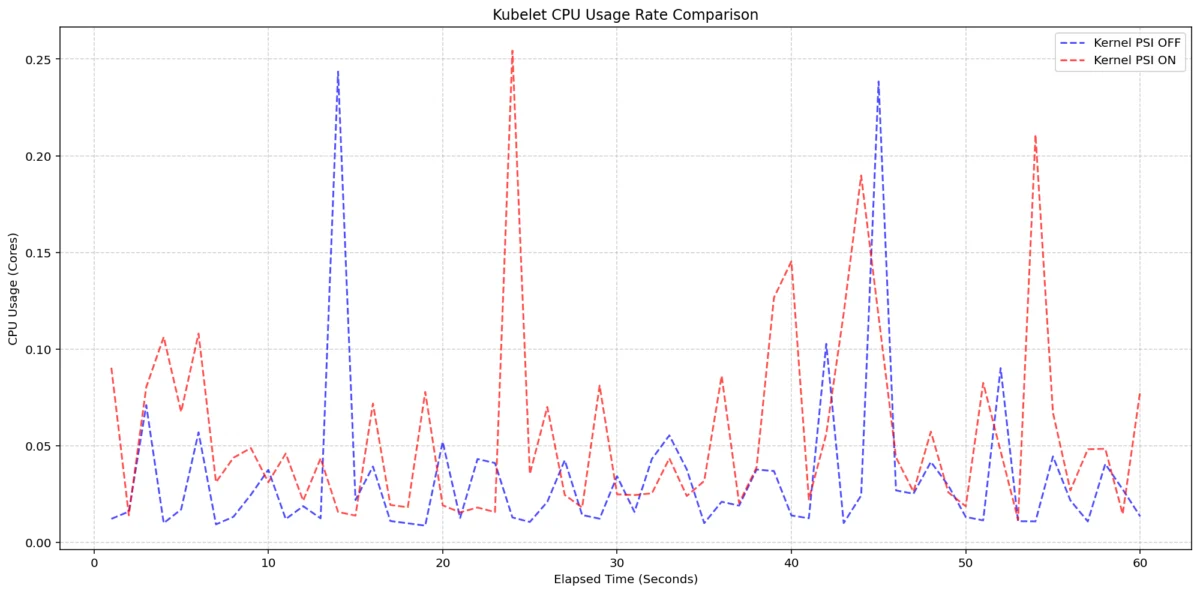
Even under heavy I/O and CPU pressure at 80-pod density, the System CPU delta remained consistently low, fluctuating between 0.037 and 0.125 cores (roughly 0.9% to 3.1% of node capacity). While there was a single, transient spike to 5.6%, the system stabilized within seconds. This confirmed that the internal kernel overhead is not only manageable but highly efficient, even under significant load.
Technical Implications for Operators
With the GA release, the implementation of PSI brings immediate, tangible benefits to cluster management. By querying the /metrics/cadvisor endpoint, administrators can now incorporate PSI into their Prometheus-compatible monitoring stacks.
How to Access the Data
For those who need immediate, real-time insights, the Summary API remains the most direct route. While caution is advised—as proxying to the Kubelet is a privileged operation—administrators can use the following command to retrieve granular data for a specific container:
CONTAINER_NAME="example-container"
kubectl get --raw "/api/v1/nodes/$(kubectl get nodes -o jsonpath='.items[0].metadata.name')/proxy/stats/summary" | jq '.pods[].containers[] | select(.name=="'$CONTAINER_NAME'") | name, cpu: .cpu.psi, memory: .memory.psi, io: .io.psi'
This output provides a clear, per-container view of where the bottlenecks lie. If a container is showing high memory pressure, it may be time to revisit resource requests and limits. If CPU stall times are elevated, it might indicate that the node is oversubscribed or that pods are competing for shared cycles in an inefficient manner.
The Broader Impact on Cloud-Native Reliability
The inclusion of PSI as a first-class citizen in Kubernetes v1.36 marks a fundamental shift in how we define "node health."
1. Proactive Capacity Planning
Historically, SREs have been forced to be reactive, waiting for a service to breach a latency threshold before investigating. PSI allows for proactive capacity planning. By monitoring "some" and "full" pressure metrics, teams can observe trends in resource contention during peak traffic hours, allowing them to scale nodes or optimize workloads before a service degradation occurs.
2. Streamlined Debugging
When an application slows down, the blame game usually starts between the application team and the infrastructure team. PSI provides an objective, kernel-level source of truth. If the system reports high I/O stall times, the focus immediately shifts to the storage backend or disk throughput limits, saving hours of manual investigation.
3. Future-Proofing
While these metrics are currently exclusive to Linux-based nodes—given that PSI is a native Linux kernel feature—the standardization of this data across the Kubernetes ecosystem ensures that tools built today will be capable of supporting high-density, high-performance environments for years to come.
A Collaborative Achievement
The journey to GA was not a solitary effort. It was the result of the tireless dedication of the SIG Node community. From the early architectural discussions to the meticulous performance testing and final documentation, this feature is a testament to the power of open-source collaboration.
Special recognition goes to the contributors who handled the alpha-to-beta transition, ensuring that the API remained robust and the performance overhead remained negligible. Their work has effectively removed the "blind spot" that has plagued node-level monitoring for nearly a decade.
Getting Involved
As we move into the post-v1.36 landscape, SIG Node encourages all cluster administrators to begin integrating PSI into their dashboards and alerting systems. The more data we gather from production environments, the better we can refine the tools and heuristics used to manage these resources.
If you have feedback, questions, or wish to share your experience with PSI in your own clusters, please join the conversation:
- Public Slack: #sig-node
- GitHub Issues: kubernetes/kubernetes
- SIG Node Community: Join the group here
The era of "guessing" based on utilization percentages is officially over. With Kubernetes v1.36 and the power of PSI, the path toward true, observability-driven infrastructure has never been clearer.