Mastering Data Visualization: How to Unlock the Full Potential of the Arduino Serial Plotter
In the fast-evolving world of embedded systems, the ability to visualize real-time data is as critical as the code running on the microcontroller itself. For millions of hobbyists, engineers, and students, the Arduino IDE’s Serial Plotter has long served as the go-to utility for transforming raw sensor readings into intuitive, graphical representations. However, as the Arduino IDE has matured—transitioning into the robust, web-technology-based environment of Version 2.0—users have encountered a frustrating hurdle: the lack of a native, accessible interface for customizing axis scales.
While the Serial Plotter is inherently powerful, its default behavior often masks the nuances of stable signals. Specifically, the dynamic Y-axis and the fixed 50-point X-axis can obscure data trends, turning smooth waveforms into jagged, confusing visual artifacts. This article serves as a comprehensive guide to bypassing these limitations, allowing you to master your data visualization without resorting to external third-party software like Python or Processing.
The Evolution of the Serial Plotter: Why Scaling Matters
The Challenge of Modern IDE Visualization
When Arduino launched the version 2.0 IDE, it migrated to a more modern, modular architecture. While this brought better autocompletion, a revamped dark mode, and improved library management, it also changed how the Serial Plotter processes incoming data streams.
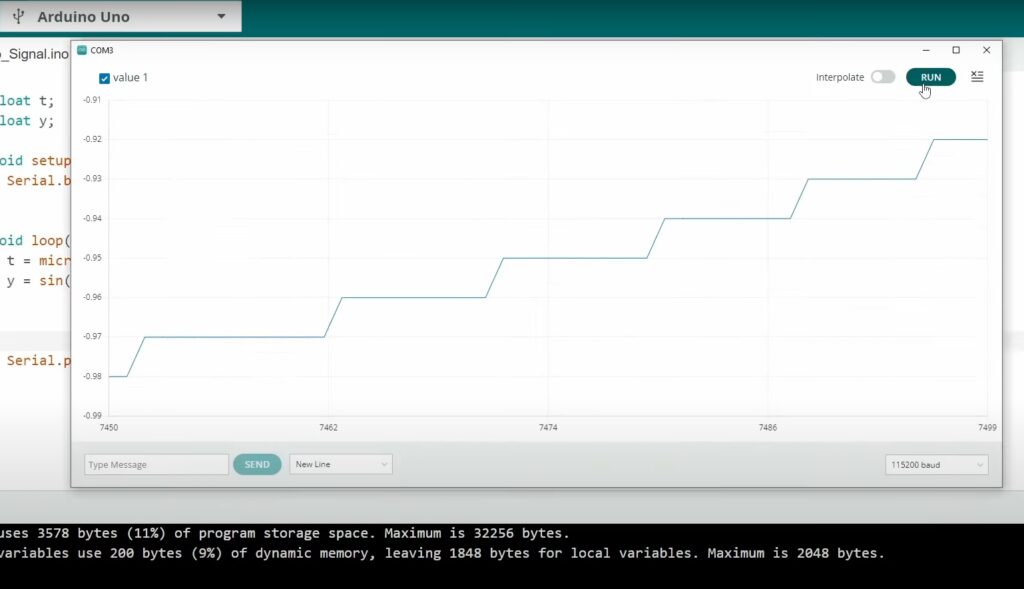
By default, the plotter is designed to be "helpful" by auto-scaling the Y-axis to the maximum and minimum values present in the last 50 data points. In high-frequency or stable applications—such as monitoring a heart-rate sensor, an analog potentiometer, or a generated sine wave—this behavior is detrimental. Because the window is constantly "breathing" to fit the current data, a stable signal can appear to fluctuate wildly. Furthermore, the X-axis is locked to a narrow window of only 50 points, which is often insufficient for capturing long-term trends or complex signal behaviors.
The Impact on Data Analysis
For an engineer, data visualization is not just about aesthetics; it is about diagnostic clarity. If your Y-axis is constantly resetting, you cannot accurately judge signal noise, drift, or frequency stability. If your X-axis window is too small, you lose the "big picture" context of your signal. Understanding how to manually force these parameters—effectively "hacking" the IDE’s display logic—is an essential skill for anyone serious about signal processing on the Arduino platform.
Chronology: From Static Limits to User-Defined Control
The development of the Arduino IDE has consistently favored accessibility over granular configuration. Historically, the Serial Plotter was a basic, separate window. As the IDE transitioned to an Electron-based framework, the Plotter became a core component of the user interface.
- The Legacy Era: Early versions of the IDE provided almost zero control over the plotter, forcing users to rely on external software for anything beyond basic debugging.
- The IDE 2.0 Transition: The introduction of the new interface provided better performance but locked the plotter configuration files deep within the application’s directory structure.
- The "Hacker" Era: As users discovered that the IDE’s front-end is largely powered by JavaScript and CSS, a community-driven movement emerged to modify the underlying source files to force the plotter into submission.
Strategic Solutions: Taking Control of Your Data
To regain control, we must address the two axes independently. The Y-axis can be managed via clever data injection, while the X-axis requires a direct modification of the IDE’s core configuration files.
1. Stabilizing the Y-Axis: The "Dummy Variable" Technique
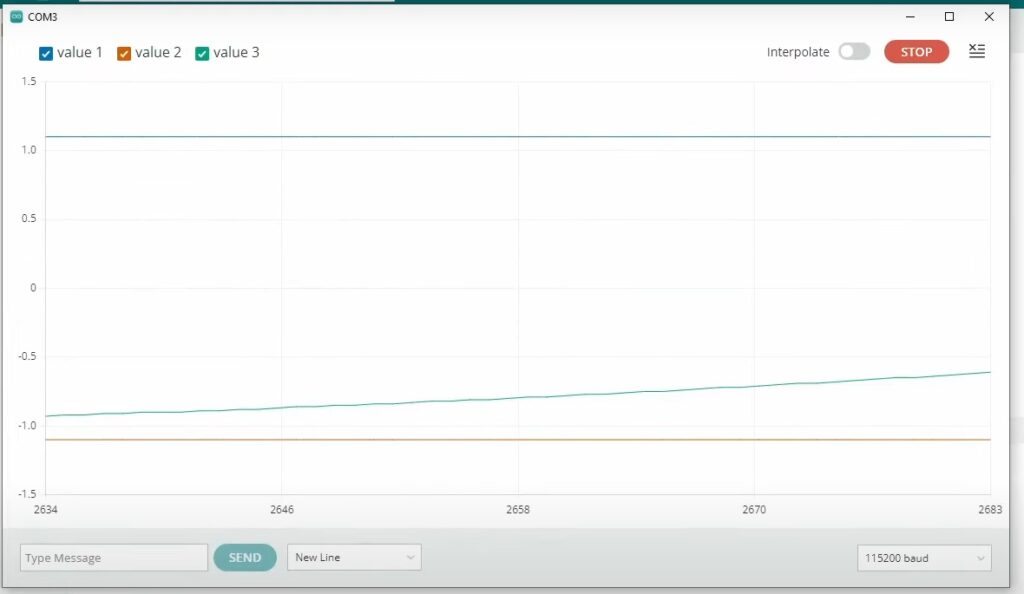
You do not need to modify the IDE to fix the Y-axis. Instead, you can "trick" the auto-scaler by providing it with constant boundary values. By including high and low set-point values in your Serial.println() stream, the plotter will always include those points in its calculation, effectively "locking" the scale to your desired range.
The Implementation:
float t; float y;
void setup()  Serial.begin(115200);

void loop()
  t = micros() / 1.0e6;
  y = sin(2 * PI * t);
  // Injecting fixed boundaries to stabilize the Y-axis
  Serial.print(1.1); // Upper bound
  Serial.print(", ");
  Serial.print(-1.1); // Lower bound
  Serial.print(", ");
  Serial.println(y);
  delay(10);
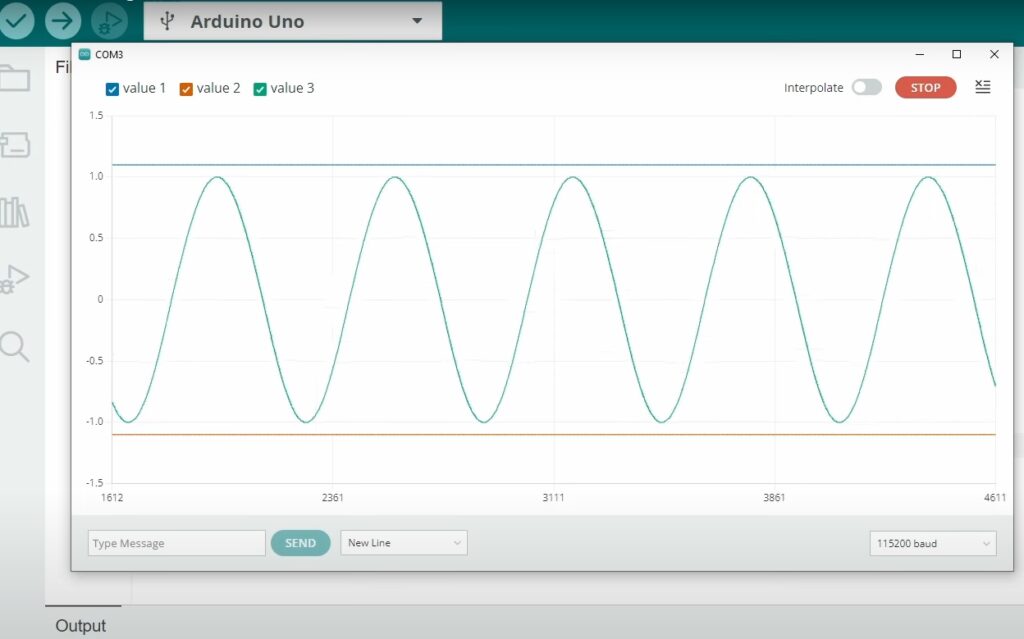
By printing 1.1 and -1.1 alongside your data, you force the plotter to keep the view zoomed out, ensuring your signal remains perfectly centered and consistent.
2. Extending the X-Axis: A Deep Dive into IDE Configuration
Modifying the X-axis is more invasive, as it requires locating the specific JavaScript file responsible for rendering the plotter’s viewport.
Locating the Configuration File
Depending on your operating system, the file resides within the application data folder of your Arduino installation.
- Windows:
C:Users<YourUser>AppDataLocalArduino15packagesarduinotoolsarduino-ide-extensions...(Look for themain.xxxxxx.chunk.jsfile). - macOS:
/Users/<YourUser>/Library/Application Support/arduino-ide/...
The Modification Process
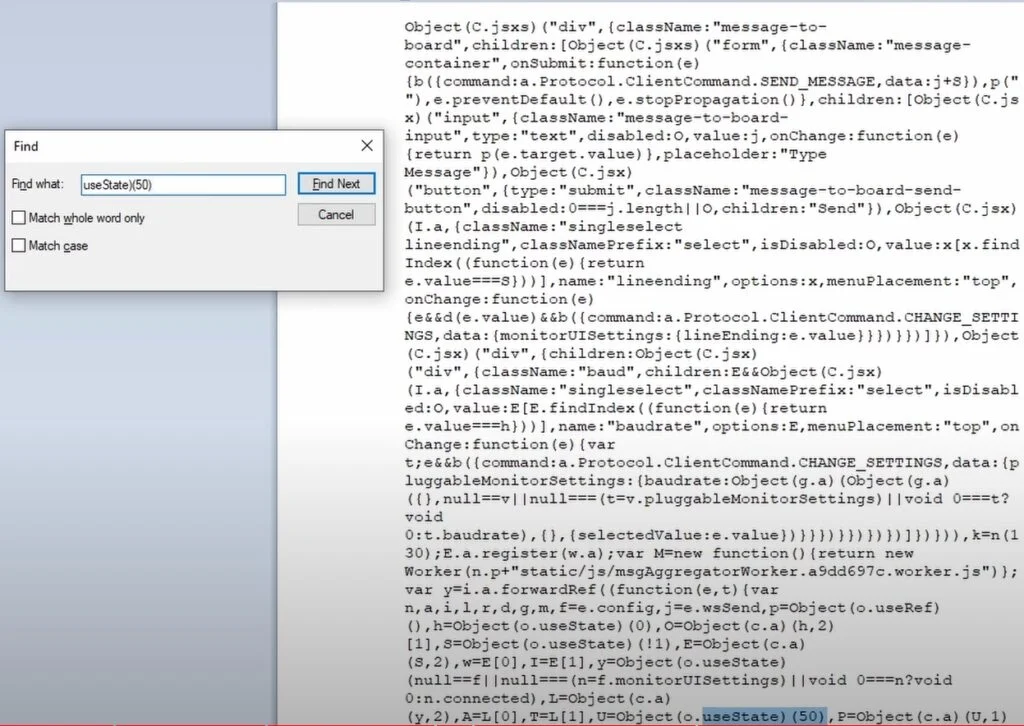
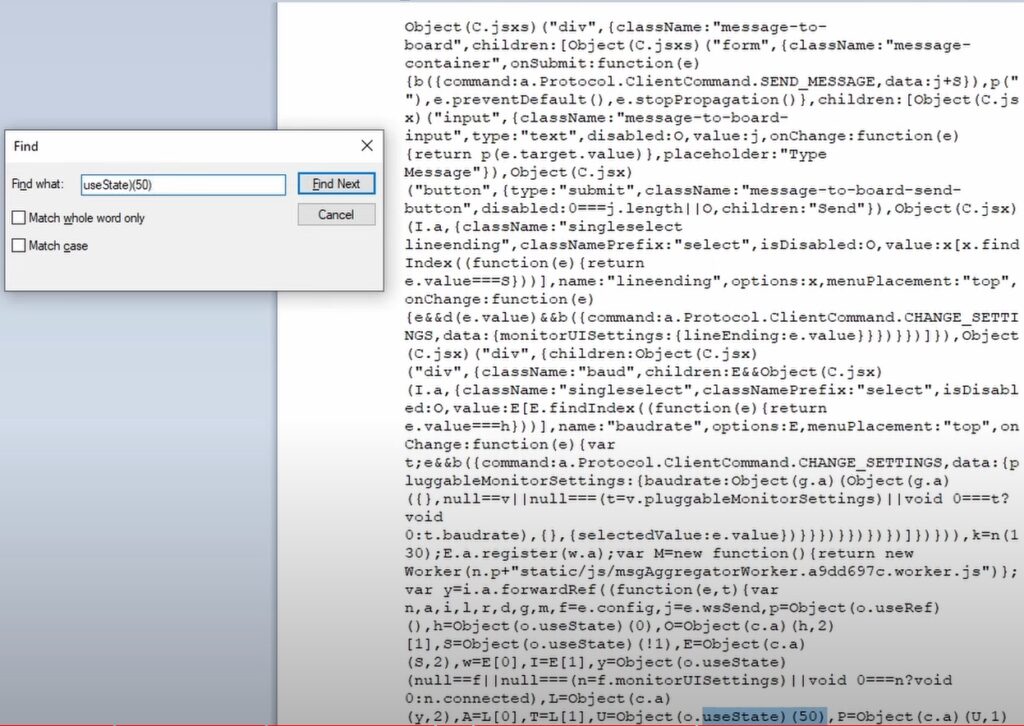
Once you have located the main.35ae02cb.chunk.js (or similar, depending on your version), you must use a code editor like VS Code or Notepad++ to perform the edit.
- Search for the Buffer Limit: Use the "Find" function (Ctrl+F) to search for the value
50. You are looking for a variable associated with the plotter’s buffer ormaxPoints. - Adjust the Value: Replace
50with your desired buffer length—for example,500or1000. - Save and Reload: After saving the file, you must restart the Arduino IDE for the changes to take effect.
Warning: Be careful not to alter the file structure or syntax. A single misplaced character can cause the Serial Plotter to crash upon opening.
Supporting Data: Performance Limits and Considerations
While extending the X-axis provides more visibility, it is not without physical limitations. The Arduino IDE is not a dedicated data-logging suite. The memory overhead required to render a large number of data points on the screen can lead to significant latency.
- Data Overload: If you increase the X-axis buffer to 5,000 points, the IDE must track and re-render all 5,000 points every time a new packet arrives. If your baud rate is set to 115,200, the CPU usage of the IDE may spike, leading to stuttering or a complete freeze.
- Optimal Settings: For most applications, a buffer of 200–500 points offers the best balance between visual range and system stability.
Implications for Future Projects
By mastering these "hacks," you are doing more than just fixing a chart; you are gaining a deeper understanding of how modern development tools are constructed. The move toward web-based IDEs means that many of our daily tools are essentially browsers in disguise. Knowing how to locate and tweak these files empowers you to customize your workflow in ways the original developers may not have intended.
However, the industry standard for high-level data analysis remains external environments. If your project requires long-term data logging, historical analysis, or complex FFT (Fast Fourier Transform) visualization, it is highly recommended that you eventually transition to:
- Python (Matplotlib/PyQtGraph): For professional-grade plotting.
- Processing: For real-time visual art and signal representation.
- Serial Plotter (Third-Party): Tools like SerialPlot or DataPlotter offer dedicated features like zooming and exporting to CSV without requiring IDE modification.
Final Conclusion
The Arduino Serial Plotter is a testament to the platform’s commitment to simplicity, but it does not have to be a cage. By employing the "Dummy Variable" technique for the Y-axis and performing targeted file modifications for the X-axis, you can transform a basic debugging tool into a functional, reliable visualization instrument.
As you continue to iterate on your hardware projects, remember that the tools we use are just as malleable as the code we write. Whether you are debugging a complex sensor array or simply monitoring a basic PWM signal, the ability to control your visualization environment is the hallmark of a seasoned maker. Take the time to experiment with these settings, find the balance that suits your computer’s performance, and continue pushing the boundaries of what your Arduino can show you. Happy coding!