In the fast-evolving landscape of artificial intelligence, deploying machine learning (ML) models onto resource-constrained edge devices—such as smartphones, IoT sensors, and smart appliances—presents a persistent engineering paradox. Developers demand maximal performance with minimal latency, yet these hardware targets feature heavily restricted memory budgets.
TensorFlow Lite (TFLite) has long been a leading solution for this challenge. By utilizing an innovative memory arena that minimizes memory usage through dynamic buffer-sharing between tensors, TFLite allows massive deep learning architectures to fit snugly within micro-environments.
However, efficiency rarely comes for free. In a recent performance audit of TFLite’s runtime, Google engineers discovered a hidden bottleneck: the mechanisms responsible for initializing and managing the memory arena were creating substantial overhead. For complex models featuring variable input sizes and dynamic tensors, the memory arena management tools were unexpectedly consuming over 50% of total runtime execution.
Through rigorous profiling using Android’s Simpleperf and targeted C++ optimizations, the TensorFlow core team successfully slashed this overhead. The resulting upgrades—integrated natively into TensorFlow 2.13—reduced overall model runtime by up to 25% in worst-case scenarios, shifting the computational burden away from runtime allocation and back where it belongs: executing neural network layers.
Chronology: The Step-by-Step Optimization Journey
Understanding how the TensorFlow team diagnosed and dismantled these performance roadblocks requires looking closely at their methodology. Rather than guessing where code bottlenecks occurred, engineers relied on empirical data gathered directly from target mobile hardware.
Phase 1: Profiling the Baseline with Simpleperf
Machine learning is rarely deployed in a vacuum; it typically operates within a broader, multi-threaded application pipeline. While TFLite is intrinsically fast, application developers must ensure that the surrounding orchestration code does not introduce drag.
To pinpoint exact inefficiencies, engineers utilized Simpleperf, a native profiling tool built into the Android NDK. By capturing performance data on a connected development device via adb, the team generated detailed execution profiles.
The workflow utilized the following core scripts:
Pushing and Running:/usr/lib/android-ndk/simpleperf/run_simpleperf_on_device.py record --call-graph fp /data/local/tmp/my_binary arg0 arg1 ...
Pulling Data:adb pull /data/local/tmp/perf.data
Building the Cache:/usr/lib/android-ndk/simpleperf/binary_cache_builder.py -lib /your/binarys/folder -i perf.data
Visualizing with Pprof:pprof -http :8888 profile.proto
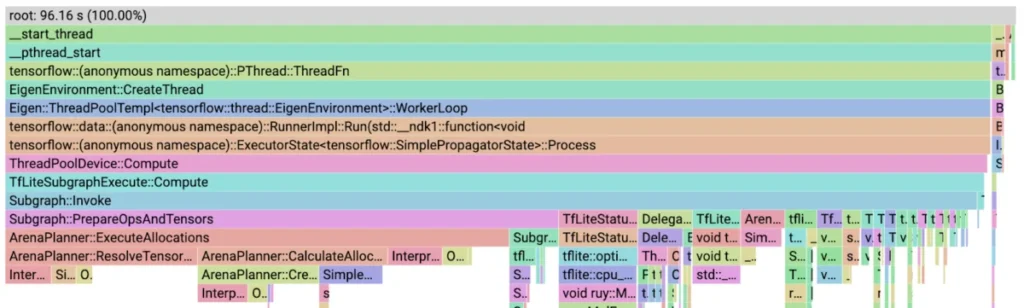
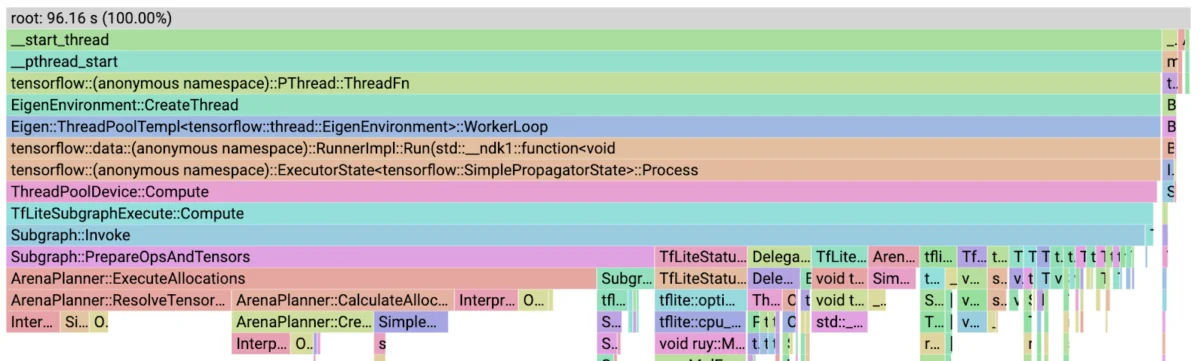
Opening localhost:8888 revealed interactive flame graphs, exposing the surprising truth about where CPU cycles were actually being spent.
Phase 2: Uncovering the First Bottleneck (ArenaPlanner::ExecuteAllocations)
Initial assumptions pointed toward heavy ML operators—such as convolutions or fully connected layers—as the primary bottlenecks. Instead, the profile revealed that ArenaPlanner::ExecuteAllocations accounted for a staggering 54.3% of the model’s total runtime.
While this particular model represented a worst-case scenario featuring variable input sizes and dynamic tensors (which trigger frequent, runtime-dependent re-allocations), it exposed systemic inefficiencies that impacted all models.
Drilling deeper into the call stack, engineers found that InterpreterInfo::num_tensors() consumed 10.4% of the runtime entirely on its own. The culprit? It was implemented as a virtual function calling another function inside a continuous loop:
for (int i = 0; i < static_cast<int>(graph_info_->num_tensors()); ++i)
  // ...
Because the arena planner does not create or destroy tensors during this execution phase, the total number of tensors remains invariant. Caching this value yielded immediate dividends:
const int num_tensors = static_cast<int>(graph_info_->num_tensors());
for (int i = 0; i < num_tensors; ++i)
  // ...
Combined with a second optimization targeting InterpreterInfo::tensor(unsigned long)—replacing redundant bounds-checking virtual calls with a direct pointer to the underlying tensor array—this first round of fixes reduced the model’s total runtime by 25% and halved the overhead of the memory allocator.
Phase 3: Refining Allocation Vectors and Resolution
With the initial layer of waste stripped away, engineers re-profiled the system. The next target was ArenaPlanner::CalculateAllocations (12.7% of runtime), which houses two major sub-functions: SimpleMemoryArena::Allocate and ArenaPlanner::CreateTensorAllocationVector.
ArenaPlanner::CreateTensorAllocationVector is responsible for identifying which tensors require allocation between two adjacent nodes in the execution graph, sorting them by size to feed a "Greedy by Size" allocation algorithm. Because graph structures are inherently static, checking every single tensor in the model at every node was deeply redundant.
Engineers replaced this brute-force check with a pre-computed map of tensors allocated at each node. This brought the runtime cost of CreateTensorAllocationVector plummeting from 4.8% down to 0.8%.
Next came ArenaPlanner::ResolveTensorAllocation (accounting for 10.9% of runtime), which systematically reset each tensor’s data pointer post-allocation. Recognizing that these pointers rarely changed between consecutive cycles, the team implemented a tracking mechanism to update only modified pointers. Following this adjustment, ResolveTensorAllocation vanished from the performance profile entirely.
Phase 4: Rethinking Deallocation and Data Structures
Attention then shifted to memory allocation and deallocation routines (SimpleMemoryArena::Allocate and SimpleMemoryArena::Deallocate), which accounted for 7% and 6.8% of runtime, respectively.
TFLite originally stored allocation records in an std::vector ordered by their memory offsets. Insertion, removal, and searching operations within vectors are traditionally O(N). Naturally, engineers wondered if switching to an std::multimap (offering O(log N) insertions and removals) would improve performance.
Counterintuitively, switching to a multimap slowed the code down by nearly three times. While theoretical algorithmic complexity favors maps, practical hardware execution depends heavily on constant factors and memory locality. Iterating through contiguous memory in a vector is vastly cheaper on modern CPU caches than traversing node-based pointer trees in a map.
Deallocation, however, still suffered from an O(N²) bottleneck due to frequent calls to std::vector::erase, which forced expensive memory-shifting operations via memcpy. Engineers resolved this by:
Marking records destined for deletion rather than erasing them instantly.
Purging them in a single pass using std::remove_if.
Introducing SimpleMemoryArena::DeallocateAfter(int32_t node), which leverages the fact that ArenaPlanner typically deallocates all tensors from a specific node onward to the end of the graph.
These changes reduced deallocation complexity to O(N) and completely eliminated ResetAllocationsAfter from the profile.
Phase 5: Purging Inactive Records
The final frontier was SimpleMemoryArena::Allocate. Because the Greedy by Size algorithm inherently carries an O(N²) complexity limitation as it searches for space within the arena, engineers could not eliminate the fundamental math.
However, they could reduce N. By processing execution nodes sequentially and periodically purging allocation records for tensors tied to already-executed nodes, the active dataset shrank dramatically for large models.
Following this refinement, ArenaPlanner::ExecuteAllocations dropped from 11% to 6% of runtime. Crucially, the top of the profile was reclaimed by its rightful occupant: a fully connected neural network operator.
Supporting Data: Before and After Optimization
The cumulative impact of these micro-optimizations transformed the performance characteristics of dynamic TFLite models:
Initial State:ArenaPlanner::ExecuteAllocations consumed 54.3% of total inference time, overshadowing the actual neural network computations.
Mid-Stage Progress: Caching tensor counts and optimizing vector pointer lookups slashed overall model execution time by 25%.
Deallocation Overhaul: Replacing piecemeal vector erasure with batch processing via std::remove_if completely removed major allocation bottlenecks from the profile.
Final State: Total memory arena management overhead dropped from an alarming 49.9% down to just 11%, aligning execution profiles with standard industry expectations where math operators dominate resource utilization.
Official Responses and Technical Integration
Speaking on the broader implications for the open-source community, the TensorFlow engineering team emphasized that these performance gains require zero code modifications from end users.
"The optimized memory arena is now publicly available as part of TensorFlow 2.13," stated Alan Kelly in the official release notes. "These enhancements mean that developers deploying models with variable input sizes or dynamic tensor shapes will automatically benefit from drastic latency reductions without sacrificing the memory-saving architectures they rely on for edge deployment."
Because the underlying C++ logic improvements are baked directly into the TFLite runtime engine, mobile applications built on Android, iOS, and embedded Linux platforms instantly inherit these efficiencies upon updating their project dependencies to TensorFlow 2.13 or higher.
Implications: What This Means for Edge AI Developers
The successful optimization of TFLite’s memory arena carries profound implications for the future of on-device machine learning:
Broader Viability for Dynamic Models: Historically, models featuring dynamic shapes or variable input sizes (such as real-time object detection streams, natural language processing pipelines with varying token lengths, and pose estimation frameworks) incurred a heavy performance tax on edge hardware. By mitigating allocation overhead, TensorFlow has made dynamic architectures far more viable for mobile deployment.
Democratization of Native Profiling Tools: By documenting the exact Simpleperf and pprof workflows used during this engineering sprint, Google has provided a blueprint for the developer community. Engineers can now profile their own custom C++ execution pipelines on Android targets, translating opaque performance lags into actionable flame graphs.
Hardware Longevity and Battery Efficiency: Reducing CPU cycles spent on memory management directly correlates to lower processor utilization on mobile chips. For end-users, this translates to reduced thermal throttling, lower battery consumption, and smoother, more responsive user interfaces in AI-powered applications.
Ultimately, this deep dive into TFLite internals serves as a masterclass in systems engineering: proving that even the most mature frameworks hold hidden performance dividends for teams willing to look beyond the high-level code and profile the metal itself.