Unlocking Cluster Observability: Kubernetes v1.36 Brings Production-Ready Pressure Stall Information (PSI)
By Maria Fernanda Romano Silva (Google Cloud)
Tuesday, May 12, 2026
In the complex landscape of distributed systems, the "utilization trap" has long been a thorn in the side of site reliability engineers (SREs) and platform architects. For years, monitoring infrastructure has relied heavily on utilization percentages—measuring how much CPU or memory a node is consuming. However, high utilization does not always equate to a performance bottleneck, and low utilization can often mask severe, hidden latency issues.
With the official release of Kubernetes v1.36, the community has reached a significant milestone: the General Availability (GA) of Pressure Stall Information (PSI) integration. This feature promises to move the industry away from "guessing" about resource health toward a high-fidelity understanding of actual task contention, providing a granular view of how resource saturation impacts application performance before a full-scale outage occurs.
The Core Philosophy: Why PSI Matters
Since its inception in the Linux kernel in 2018, PSI has been heralded as a game-changer for systems programming. Unlike traditional metrics that offer a static "snapshot" of resource usage, PSI provides a dynamic narrative of "tasks stalled" and "time lost."
In a Kubernetes environment, a node might report 80% CPU utilization. To an operator, this might look healthy. However, if the remaining 20% is subject to severe scheduling delays, the workloads running on that node may be experiencing significant performance degradation. PSI solves this by exposing the percentage of time that tasks spend waiting for resources—specifically CPU, memory, and I/O. By quantifying this "wait time," PSI gives engineers the data needed to distinguish between "productive busyness" and "harmful contention."
Chronology: From Experimental Alpha to Production GA
The journey to integrate PSI into the Kubernetes ecosystem was a multi-year effort spearheaded by SIG Node. The project followed a disciplined, tiered rollout designed to ensure that the addition of these telemetry signals would not introduce performance regressions in high-density production environments.
- v1.33 (Alpha): The initial implementation introduced the ability for the Kubelet to tap into the kernel’s PSI interfaces. The primary goal during this phase was proof-of-concept: Could the Kubelet efficiently aggregate and expose this data at the pod and container levels?
- v1.34 (Beta): As the feature moved into Beta, the focus shifted to API stability and data accuracy. During this phase, contributors refined the cgroup-level aggregation logic, ensuring that PSI metrics remained consistent across varying kernel versions and Linux distributions.
- v1.36 (General Availability): With this release, the feature is now considered "stable." The Kubelet PSI integration no longer requires feature gates, meaning it is enabled by default for all supported Linux environments, marking its readiness for mission-critical infrastructure.
Supporting Data: Validating Performance at Scale
A primary concern when graduating any telemetry feature is the "observer effect"—the risk that the act of collecting metrics consumes so many resources that it actually impacts the performance of the system being monitored. To mitigate these concerns, SIG Node conducted exhaustive performance testing on high-density workloads, simulating scenarios with over 80 pods per node.
The Kubelet Overhead: Minimal Footprint
The performance validation team analyzed two critical scenarios to isolate the overhead introduced by the Kubelet’s data collection logic.
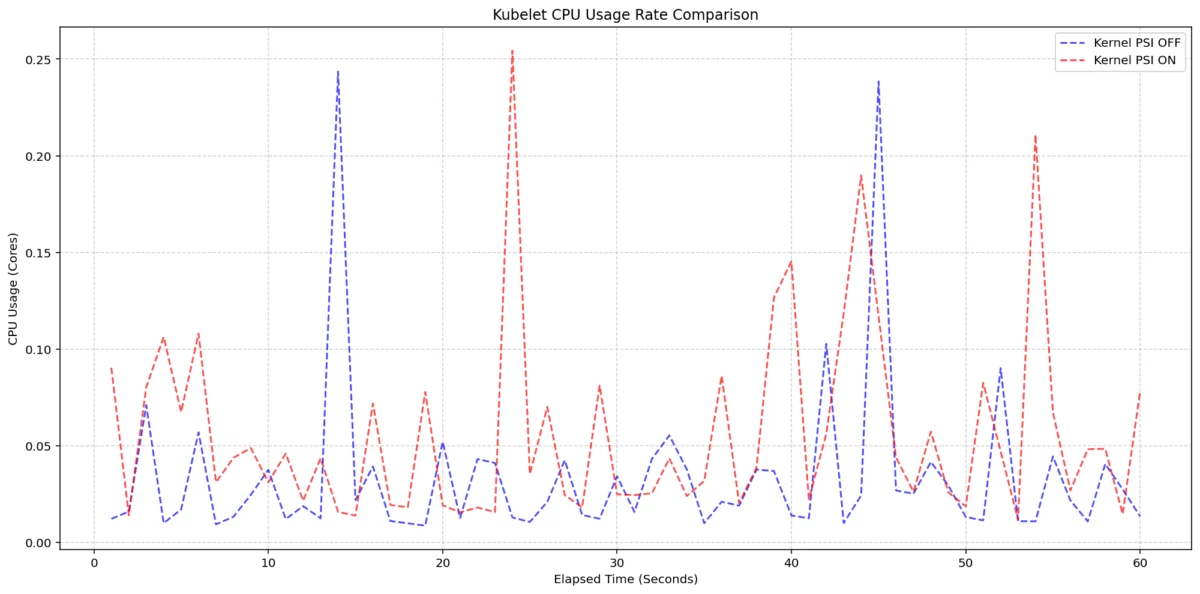
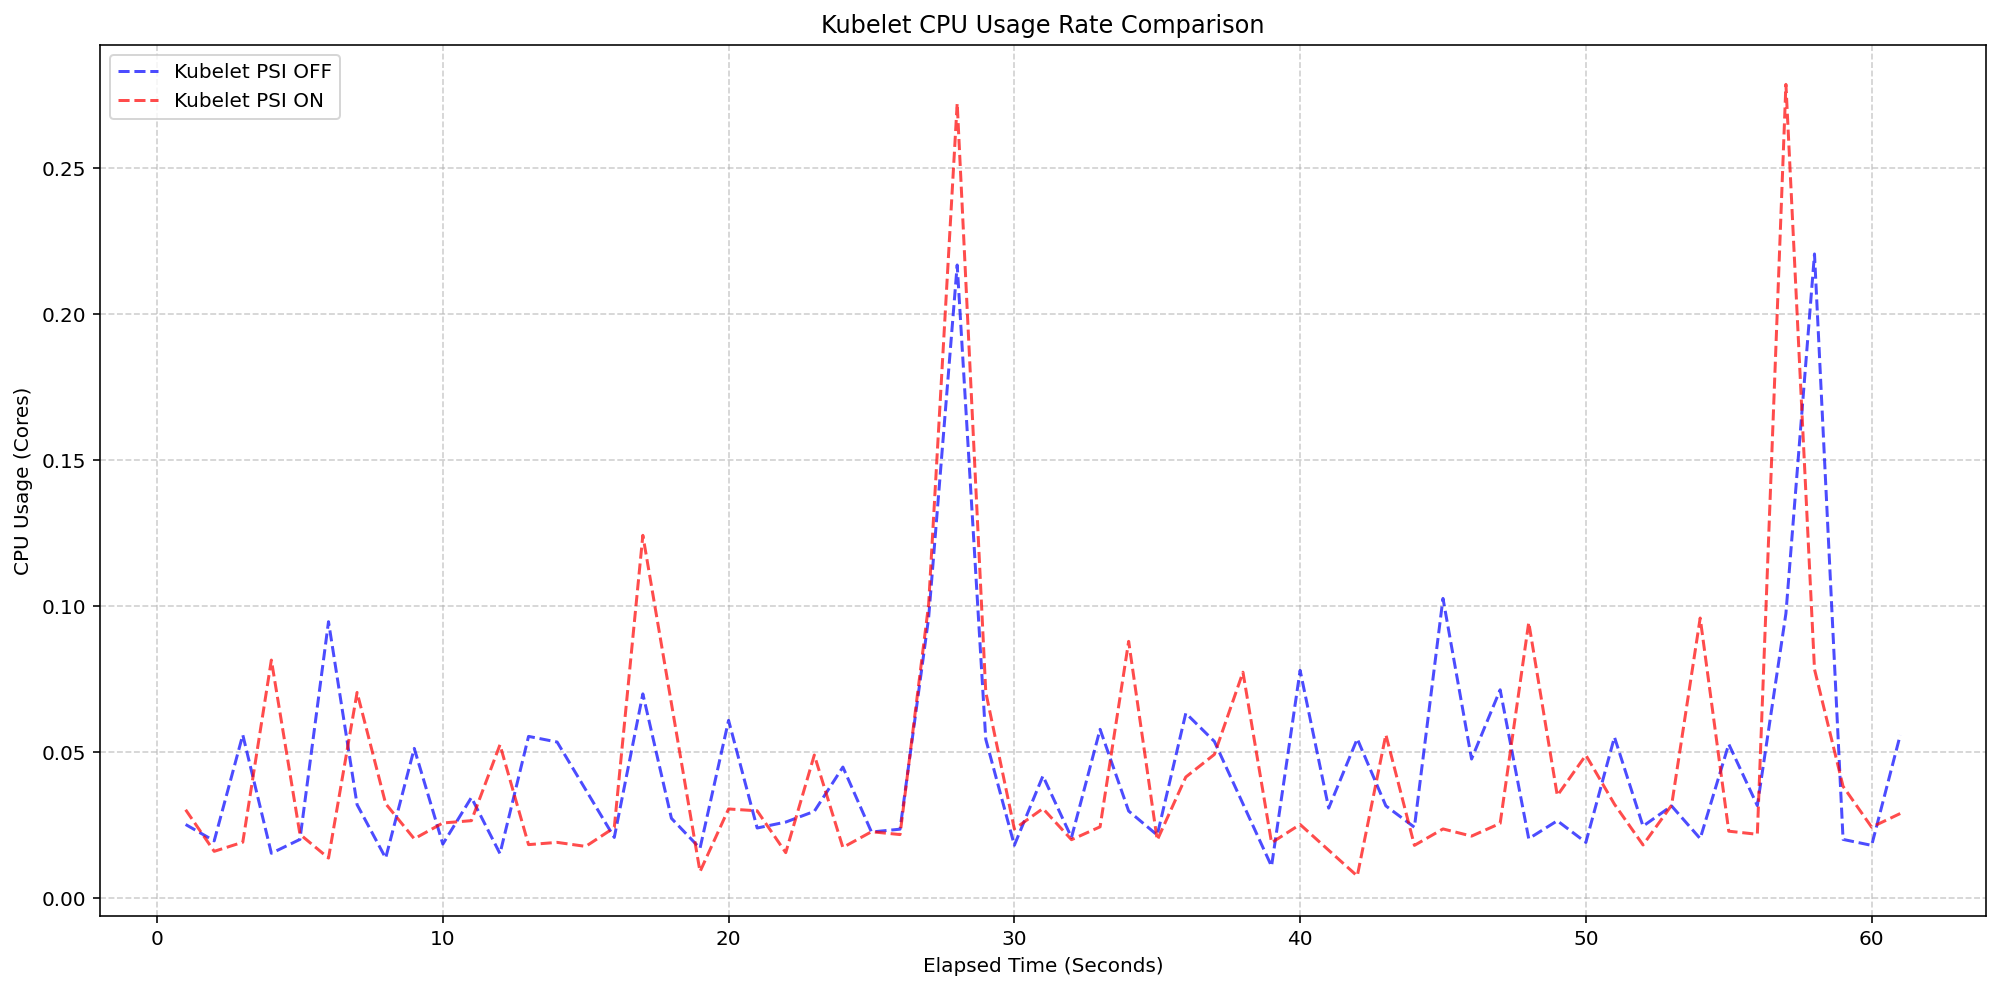
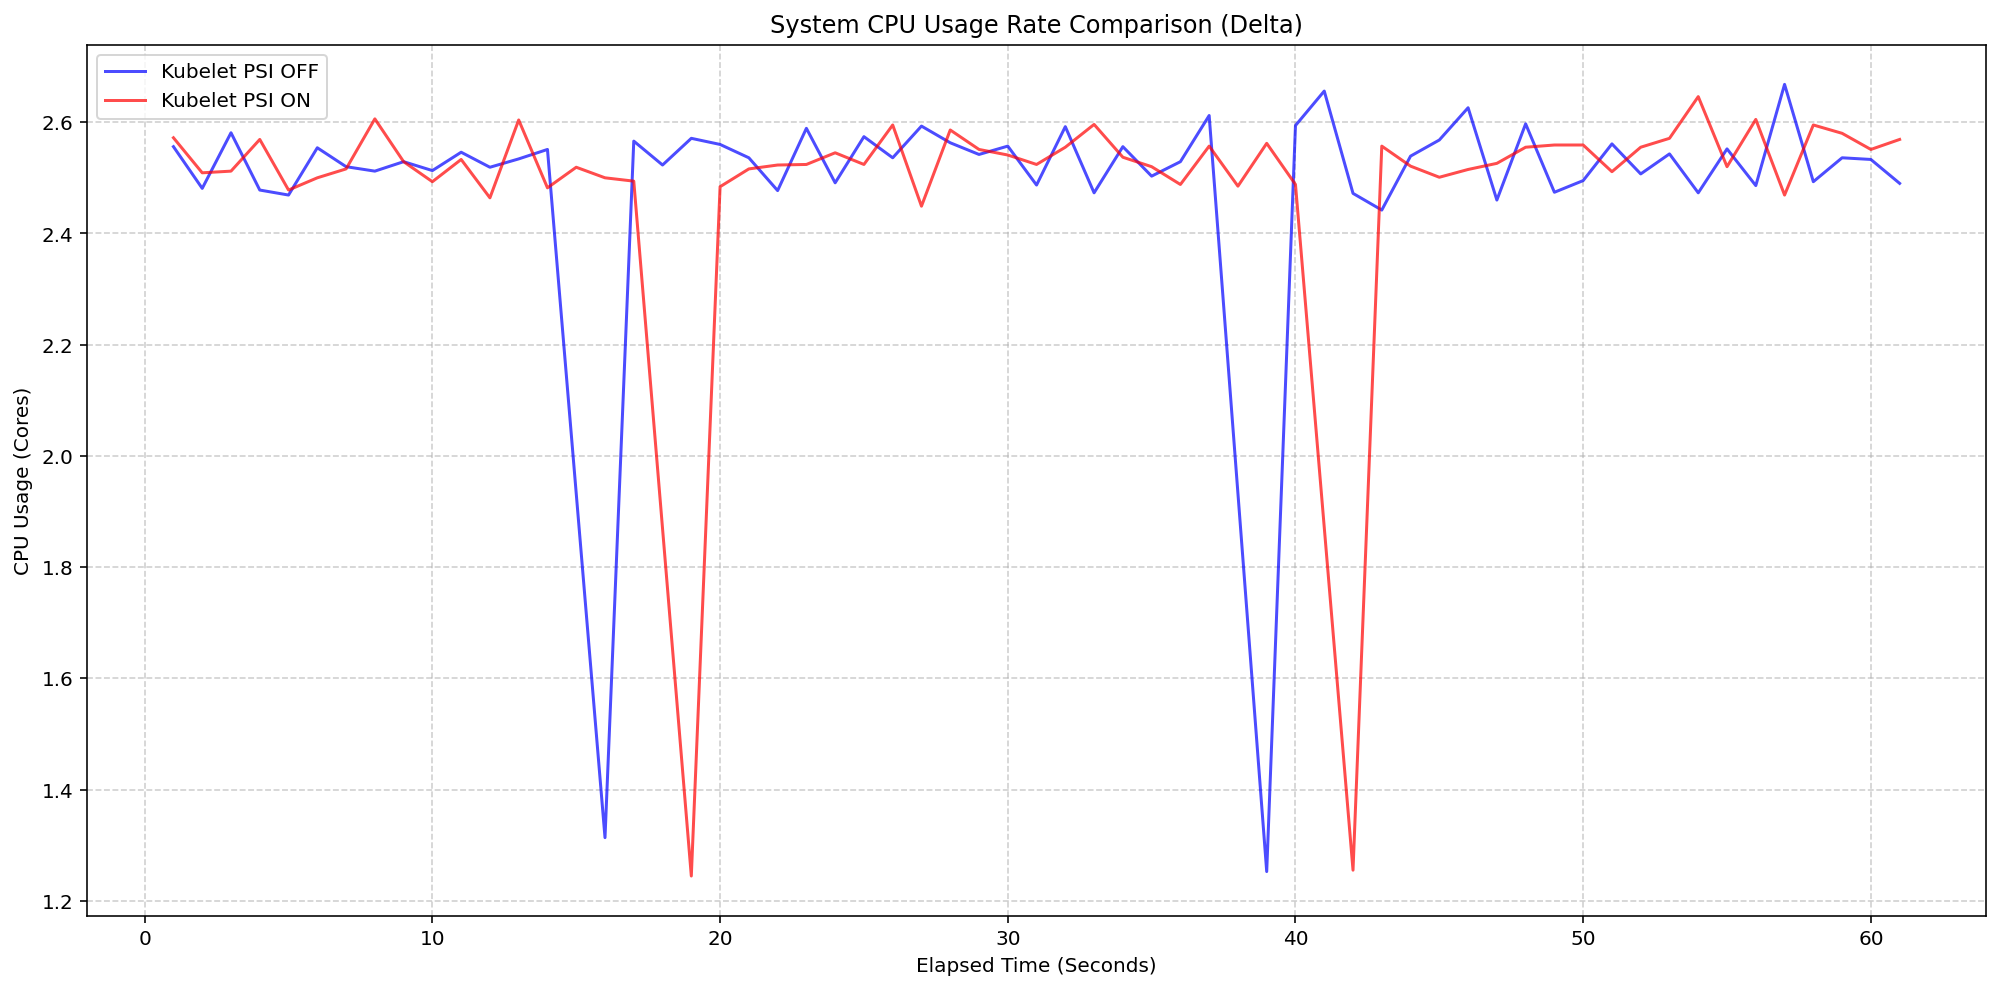
In "Scenario 1," researchers compared Kubelet CPU usage on 4-core machines with the KubeletPSI feature enabled versus disabled. The data was conclusive: the Kubelet’s collection logic is remarkably lightweight. The CPU overhead consistently stayed within the normal 0.1 cores (or approximately 2.5% of total node capacity). The graphs generated during these tests showed that the Kubelet’s internal housekeeping cycles remained unaffected by the additional PSI queries, proving that the integration is safe for high-density production clusters.
Kernel-Level Efficiency
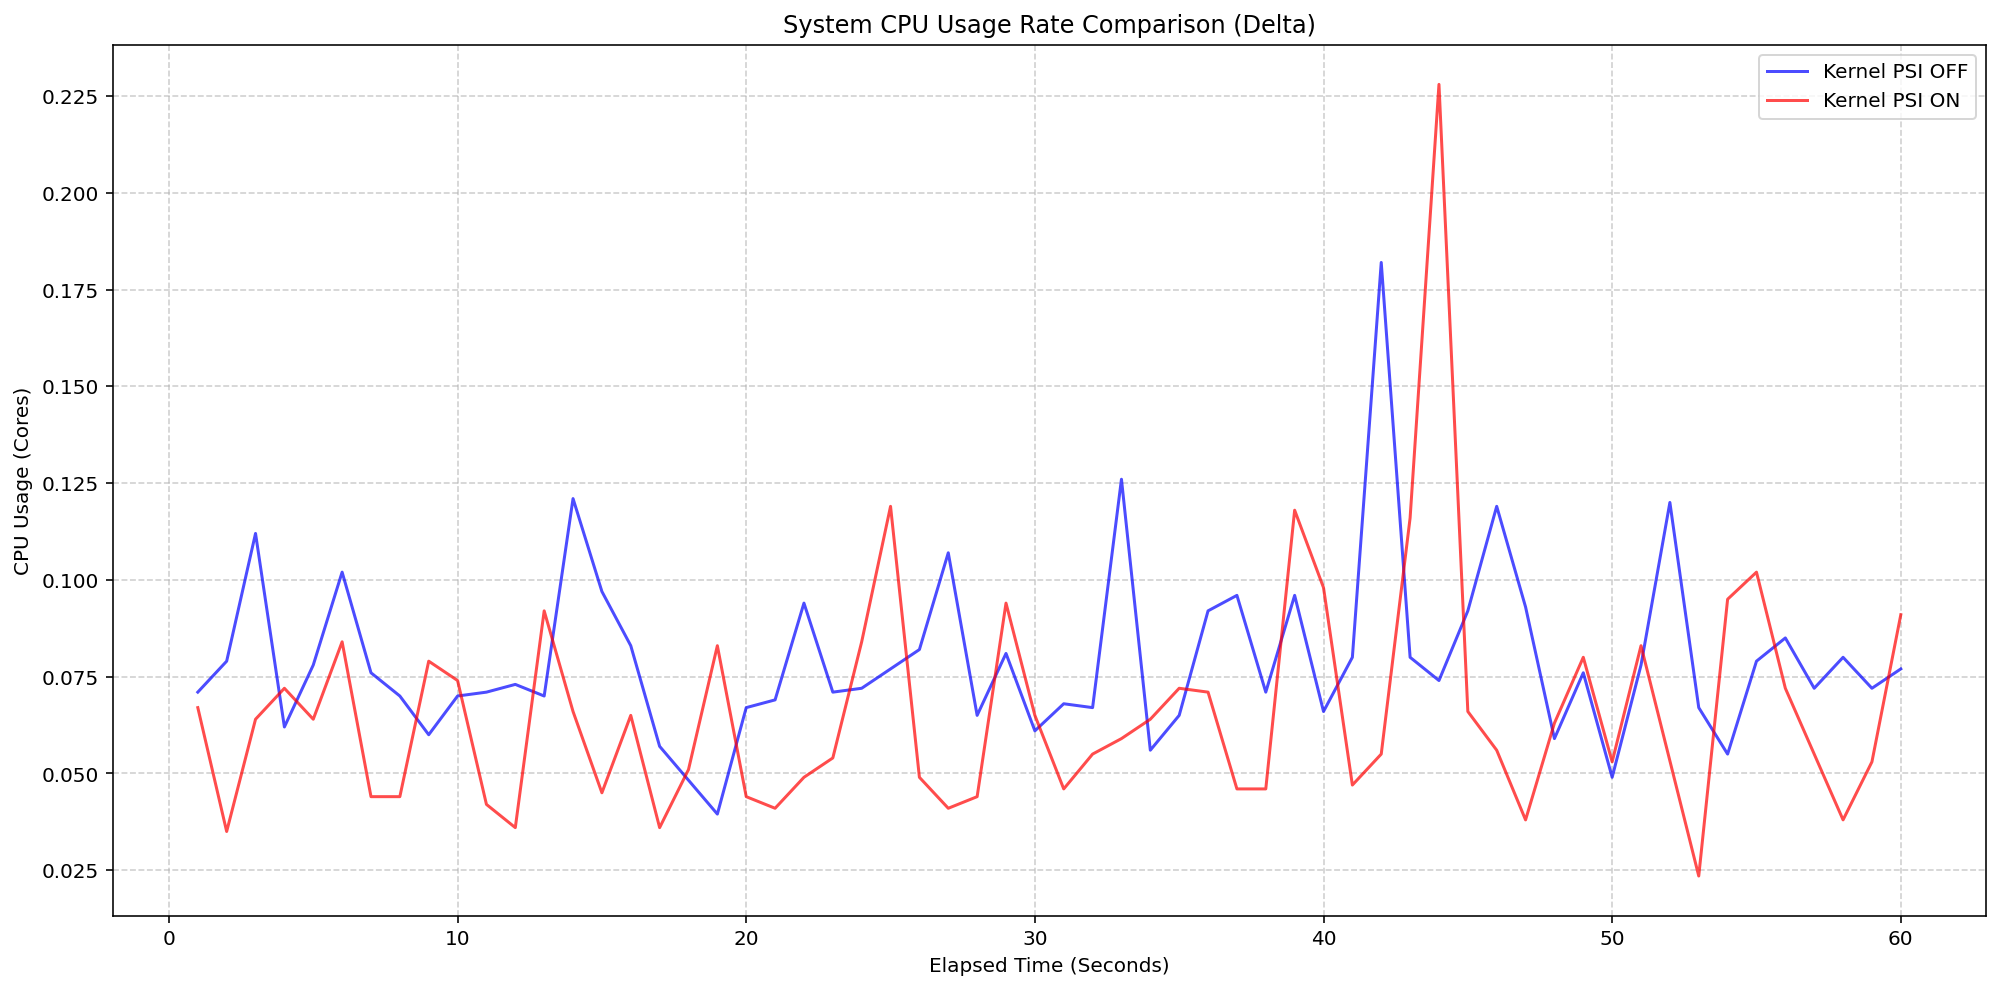
"Scenario 2" evaluated the cost of the underlying kernel bookkeeping. By comparing clusters booted with psi=1 versus those with psi=0, the team isolated the raw cost of the OS tracking pressure. Even under heavy I/O and CPU loads, the system CPU delta remained between 0.037 and 0.125 cores. Even during brief spikes—which topped out at 0.225 cores—the system recovered within seconds. These findings confirm that the internal kernel tracking mechanism is optimized for efficiency, ensuring that the cost of visibility is always outweighed by the value of the insights provided.
Implications for Cluster Operations
The integration of PSI into Kubernetes v1.36 changes the fundamental way operators approach capacity planning and incident response.
1. Proactive Scaling
With PSI metrics exposed through the Kubelet’s /metrics/cadvisor endpoint, Horizontal Pod Autoscalers (HPA) can theoretically be tuned to trigger based on pressure rather than just utilization. This allows for a more responsive infrastructure that scales out when tasks are waiting for resources, rather than waiting for the CPU to hit an arbitrary 80% threshold.
2. Precise Troubleshooting
When an application slows down, the "blame game" between teams often begins: Is it the network? The database? The CPU? PSI provides an empirical answer. If a container shows high memory pressure, it is a clear indicator that the application is thrashing due to swap or page cache contention. This specificity allows SREs to resolve root causes in minutes rather than hours.
3. Cross-Platform Considerations
It is vital to note that PSI is a native Linux-kernel feature. Consequently, these metrics are exclusively available on Linux nodes. For heterogeneous clusters, the Kubelet is designed with grace: on Windows nodes, the PSI metrics are simply omitted, preventing any interference with the node’s operations.
Getting Started: A Step-by-Step Guide
To leverage these metrics, ensure your nodes are running a kernel that supports PSI (check your distribution documentation). As of v1.36, no feature gates are required.
Scraping Metrics:
You can scrape the new PSI metrics directly from the /metrics/cadvisor endpoint using standard Prometheus configurations. The metrics include:
container_cpu_psi_some_seconds_totalcontainer_memory_psi_some_seconds_totalcontainer_io_psi_some_seconds_total
Accessing Real-Time Data:
For privileged administrators who need immediate, on-demand insights, the Summary API can be accessed via the control plane.
Caution: Accessing the Kubelet proxy is a privileged operation. Ensure that your RBAC policies are strictly configured to prevent unauthorized access.
# Example query for PSI data
CONTAINER_NAME="example-container"
kubectl get --raw "/api/v1/nodes/$(kubectl get nodes -o jsonpath='.items[0].metadata.name')/proxy/stats/summary" | jq '.pods[].containers[] | select(.name=="'$CONTAINER_NAME'") | name, cpu: .cpu.psi, memory: .memory.psi, io: .io.psi'
Official Response and Acknowledgements
The development of the PSI feature represents a triumph of community-driven engineering. The SIG Node group, responsible for the design, implementation, and rigorous testing of the feature, emphasized that the feedback from the Beta (v1.34) phase was instrumental in optimizing the data aggregation cycle.
"We wanted to ensure that PSI didn’t just provide data, but provided actionable data," said one lead maintainer. "By moving this to GA, we are empowering the Kubernetes ecosystem to build more resilient, self-aware, and performant systems."
The SIG Node group invites the community to share their experiences. Whether you are using PSI for automated alerting, capacity optimization, or post-incident analysis, your feedback is crucial. Discussions are ongoing on the Kubernetes Slack (#sig-node) and via the SIG Node GitHub repository.
As Kubernetes continues to mature, features like PSI solidify the platform’s position as the bedrock of modern cloud-native architecture—moving us one step closer to the dream of truly autonomous, self-healing infrastructure.