Unlocking the Black Box: TensorFlow and dtreeviz Bring Clarity to Machine Learning Decision Trees
By AI Industry Desk
Published by Google / Technical Analysis
Main Facts
In the rapidly evolving landscape of artificial intelligence and machine learning, model interpretability remains a critical challenge. While deep neural networks often act as opaque "black boxes," tabular data modeling relies heavily on inherently more transparent structures: Gradient Boosted Trees and Random Forests. At the heart of these dominant models lie decision trees. However, as datasets grow and tree depth increases, visualizing and understanding these structures becomes an immense hurdle for data scientists and engineers.
To address this industry-wide bottleneck, TensorFlow recently released a comprehensive tutorial highlighting the integration of dtreeviz—a state-of-the-art visualization library explicitly designed for decision tree models—with TensorFlow Decision Forests.

First introduced in 2018 by Terence Parr, dtreeviz has steadily evolved into the premier visualization library for decision trees across the Python ecosystem. By combining rigorous geometric visualization of feature spaces with intuitive, color-coded tracking of training instances, the library bridges the gap between raw statistical data and human comprehension. The newly published Google tutorial provides developers with a step-by-step roadmap to implement dtreeviz in Google Colab environments, unlocking new levels of model transparency for both classification and regression tasks.
Chronology
The journey toward advanced decision tree visualization has been marked by significant milestones over the past several years:
- 2018 (Inception): Data scientist and academic Terence Parr releases the initial version of
dtreeviz, aiming to solve a common frustration in machine learning: standard decision tree plots lacked the contextual depth needed to truly understand how models split continuous and categorical feature spaces. - The Growth Phase (2019–2021): The library gains rapid traction within the Python data science community. Developers adopt it for scikit-learn, XGBoost, and LightGBM models, turning to platforms like GitHub and Stack Overflow for community-driven support, tutorials, and algorithmic refinements.
- The Design Evolution (2022): Parr publishes comprehensive documentation and video resources detailing the theoretical design principles behind dtreeviz, emphasizing human-centric visual cues over dense text nodes.
- Present Day (TensorFlow Integration): Recognizing the industry demand for scalable, production-grade model interpretation, TensorFlow officially incorporates dtreeviz into its ecosystem via a dedicated tutorial linking TensorFlow Decision Forests to the visualization library. This integration marks a major step forward in democratizing explainable AI (XAI) for enterprise-scale tabular data.
Supporting Data
To understand the utility of dtreeviz, one must first examine the mechanics of decision trees and the data structures they generate. At its core, a decision tree maps observations about an item to conclusions about the item’s target value through a hierarchical binary tree structure.

Anatomy of a Decision Tree
Every path from the root node to a leaf predictor passes through internal decision nodes. Each internal node evaluates a single feature against a learned split point value.
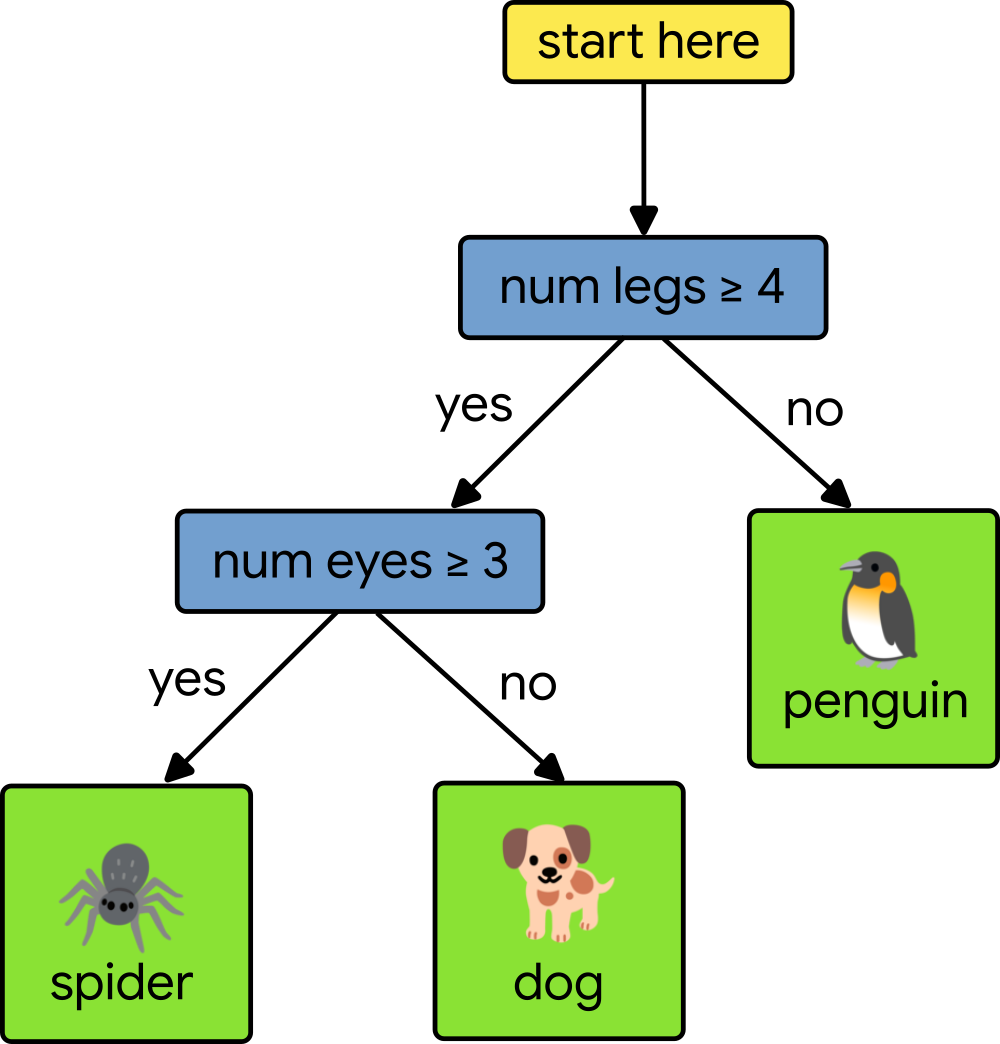
- Classification Trees: Predict discrete categories (e.g., diagnosing "cancer vs. not-cancer" or identifying animal species like penguins versus dogs based on physical attributes such as leg count and eye count).
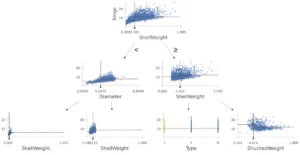
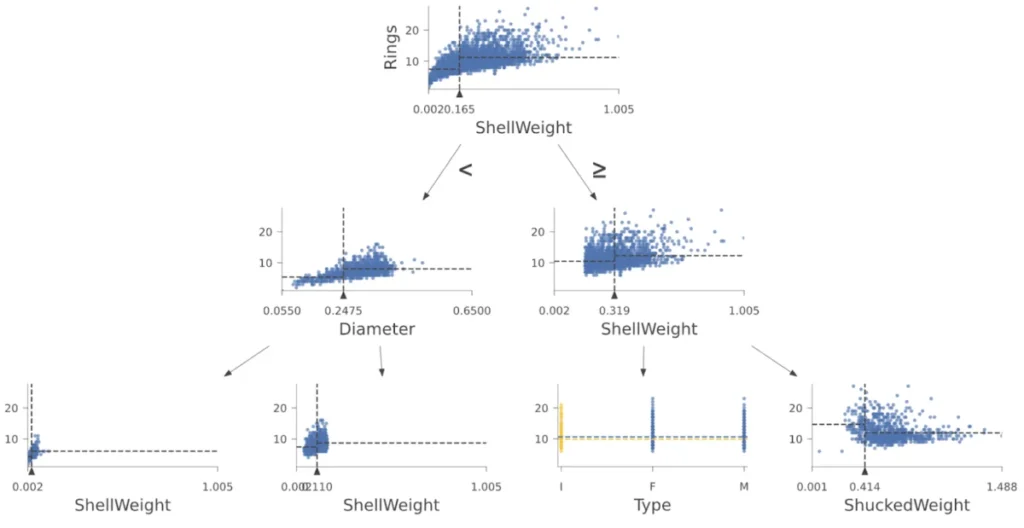
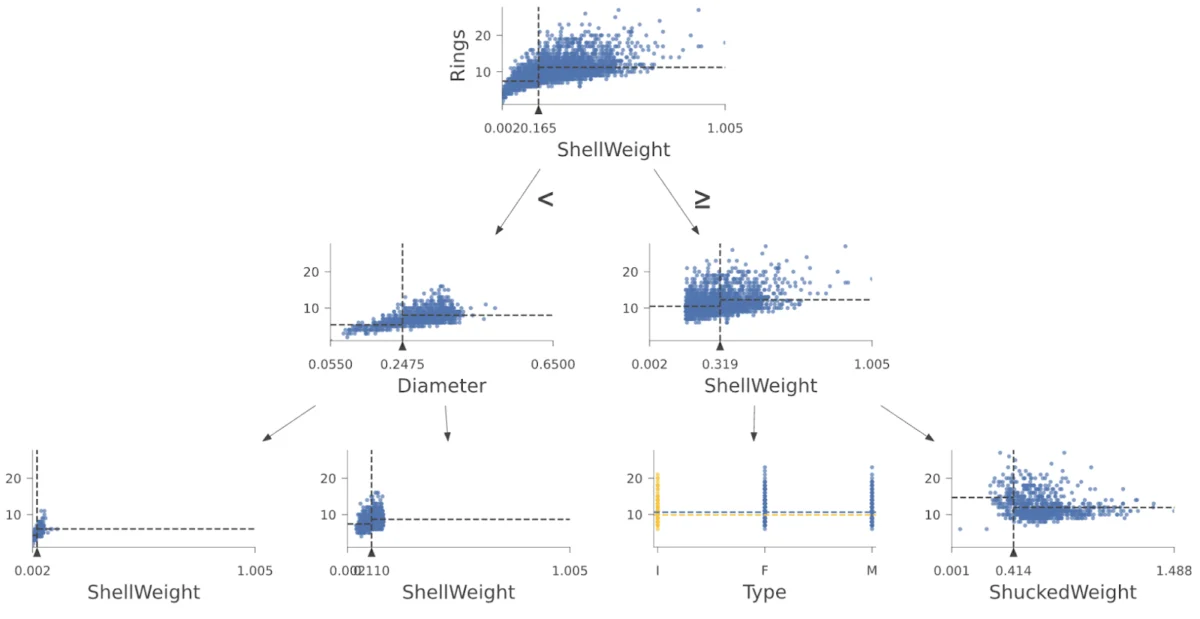
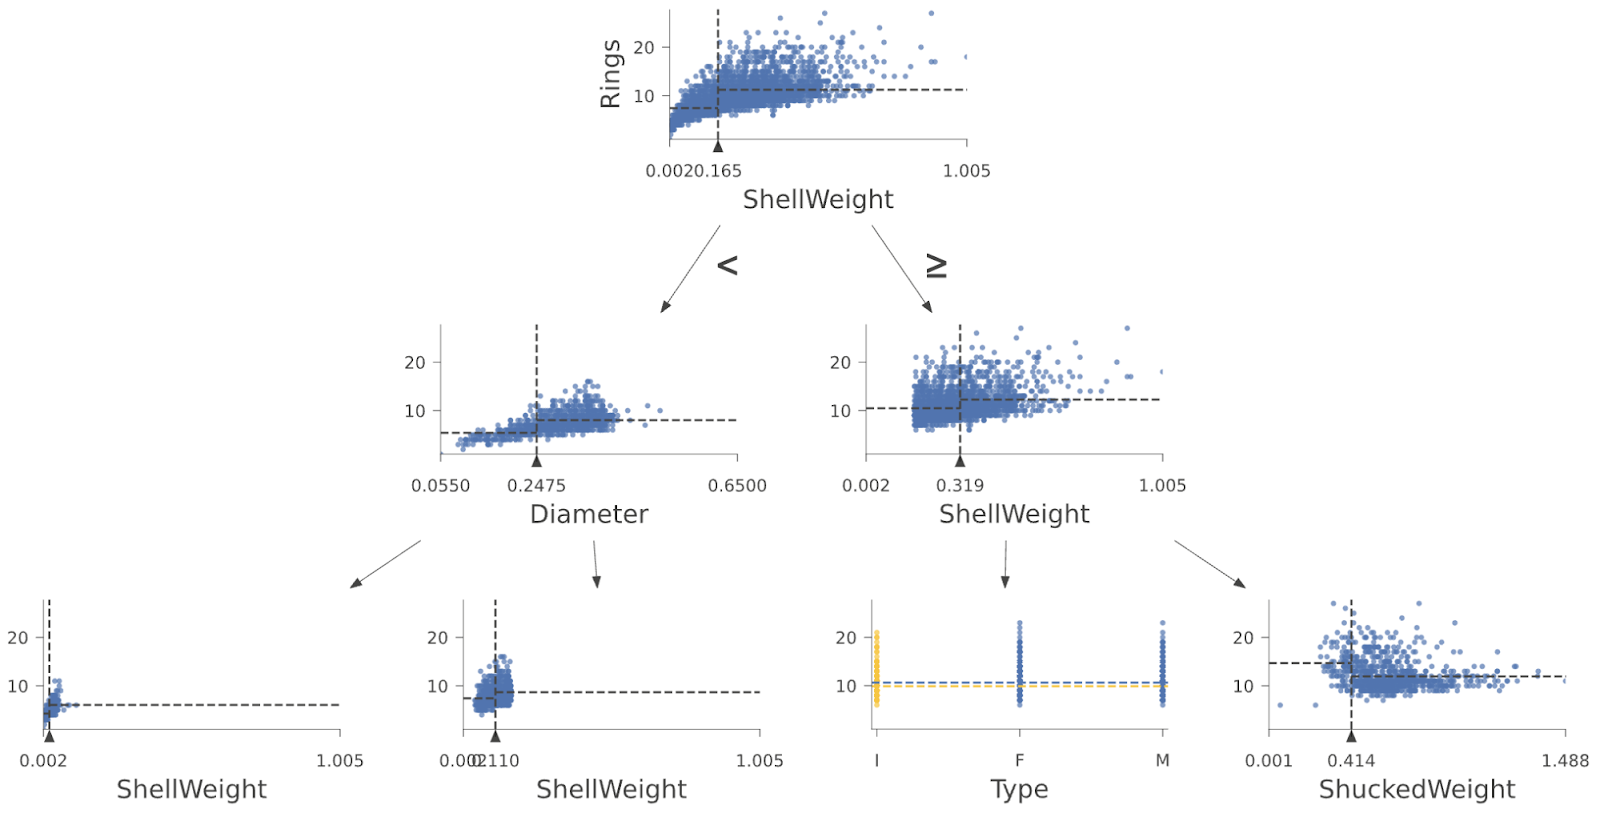
- Regression Trees: Predict continuous numerical values (e.g., predicting housing prices or estimating the age of abalone based on physical ring measurements).
Visualizing Feature Space and Leaf Distributions
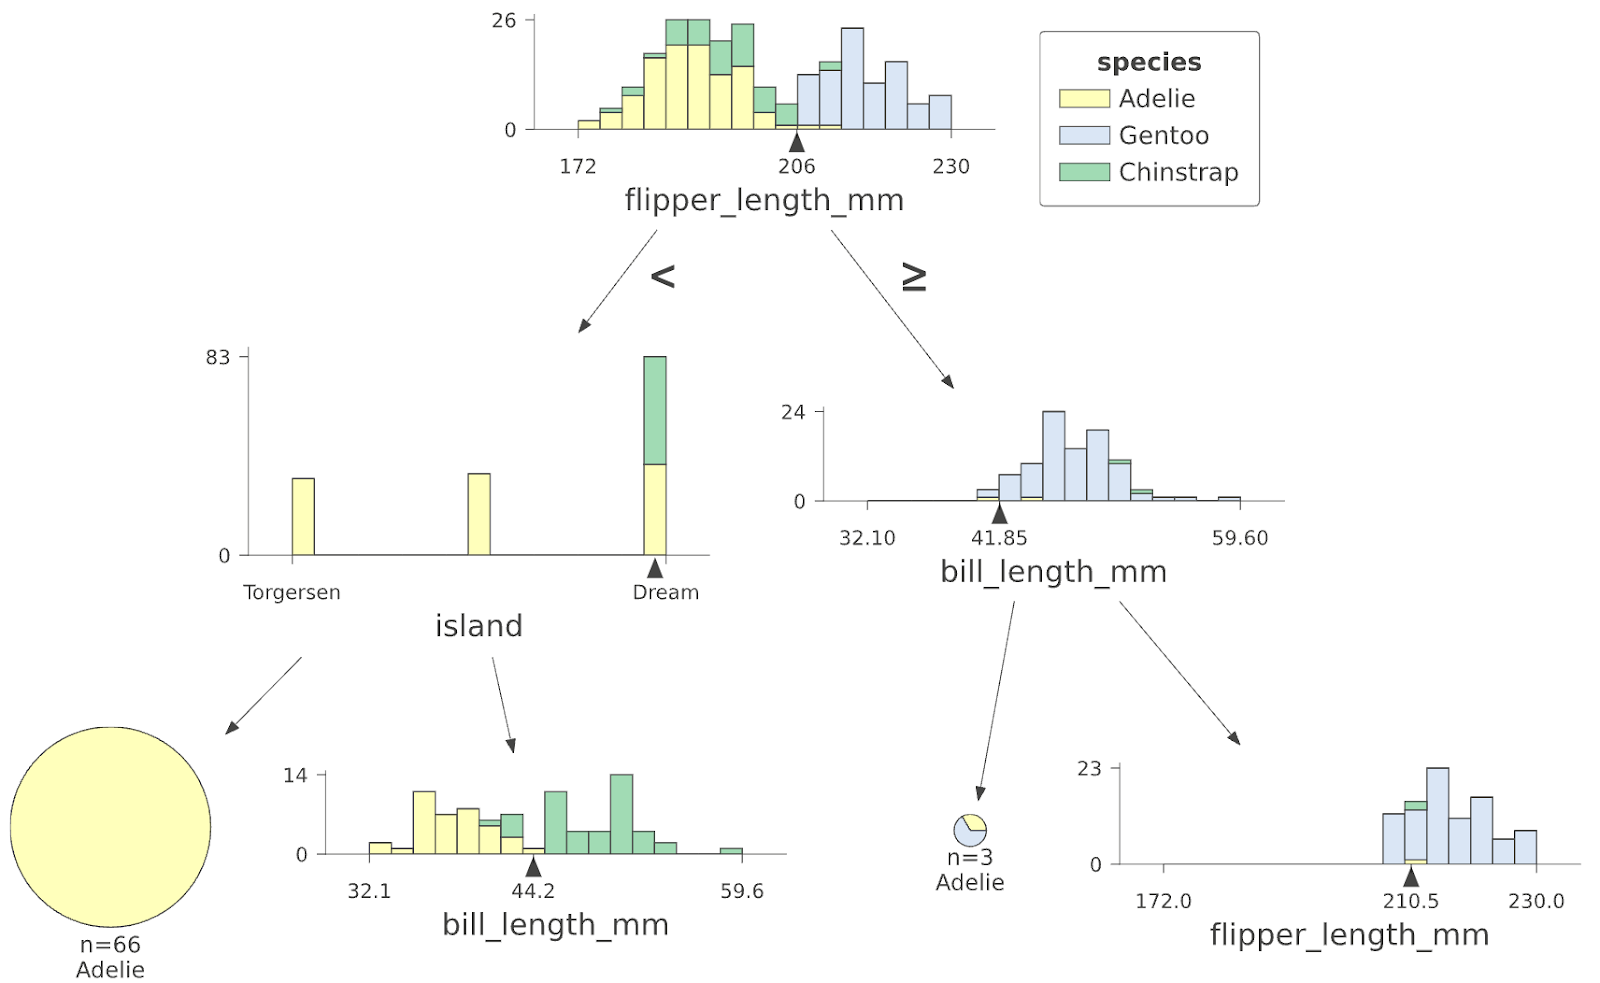
Standard plotting tools generally render decision trees as simple text boxes with basic inequality checks. In contrast, dtreeviz transforms these nodes into rich statistical plots.
- Feature Space Splits: For continuous features, dtreeviz plots stacked histograms or scatter plots at each decision node, vividly showing how a threshold (e.g., a penguin flipper length of less than 206 mm) divides the feature domain.
- Inference Tracking: When analyzing a specific test instance (such as evaluating why an individual was denied a bank loan based on credit scores or debt-to-income ratios), dtreeviz highlights the exact path taken from the root to the leaf using striking visual cues, such as orange bounding boxes.
- Leaf Distribution Analytics: Developers can invoke methods like
viz_cmodel.ctree_leaf_distributions()to generate bar diagrams or scatter plots mapping leaf IDs against samples-per-class (for classification) or target variable distributions (for regression, such as abalone ring counts).
Official Responses
The collaboration between open-source visualization pioneers and enterprise machine learning frameworks has generated enthusiastic commentary from the AI community.
In his official release notes, Terence Parr emphasized the vital role visualization plays in effective machine learning development:
"To learn how decision trees work and how to interpret your models, visualization is essential. The dtreeviz library allows practitioners to move beyond blind trust in accuracy metrics and actually see how their models carve up feature space to make critical predictions."
Industry analysts have similarly praised the TensorFlow tutorial, noting that regulatory pressures in sectors like finance, healthcare, and human resources increasingly demand "explainable AI." By integrating advanced visualization directly into production workflows, frameworks like TensorFlow are making it significantly easier for organizations to audit models for bias, error, and compliance.
Implications
The mainstream adoption of advanced decision tree visualization tools like dtreeviz carries profound implications for the future of machine learning engineering, data science education, and enterprise AI governance.
1. Enhanced Model Debugging and Error Analysis
When a machine learning model fails in production, diagnosing the root cause is often agonizingly slow. By utilizing instance-level path tracing—as demonstrated in the TensorFlow penguin and abalone datasets—engineers can instantly pinpoint why a model misclassified a specific data point. This capability shifts debugging from a process of trial-and-error hyperparameter tuning to targeted, data-driven feature engineering.
2. Regulatory Compliance and Trust (XAI)
As governments worldwide draft stricter regulations regarding automated decision-making (such as the European Union’s Artificial Intelligence Act), black-box models face increasing scrutiny. While deep learning remains difficult to interpret, tree-based models enhanced by libraries like dtreeviz provide transparent, auditable decision trails. Financial institutions evaluating loan applications or medical clinics diagnosing patients can visually verify and explain every logical step a model takes.
3. Democratization of Machine Learning Education
Complex mathematical concepts regarding entropy, Gini impurity, and feature space partitioning can intimidate newcomers to data science. Visual tools that translate abstract numerical thresholds into intuitive, color-coded histograms accelerate the learning curve. Tutorials bridging enterprise tools like TensorFlow with visualization libraries empower a new generation of developers to build interpretable, robust AI systems from the ground up.
Next Steps for Practitioners
Data scientists and machine learning engineers looking to elevate their workflow are encouraged to explore the official TensorFlow Decision Forests dtreeviz Tutorial. Additional theoretical depth can be found via the explained.ai dtreeviz design guide and accompanying community support channels on GitHub and Stack Overflow.