Decoding the Black Box: TensorFlow and dtreeviz Bring Advanced Visualization to Machine Learning Decision Trees
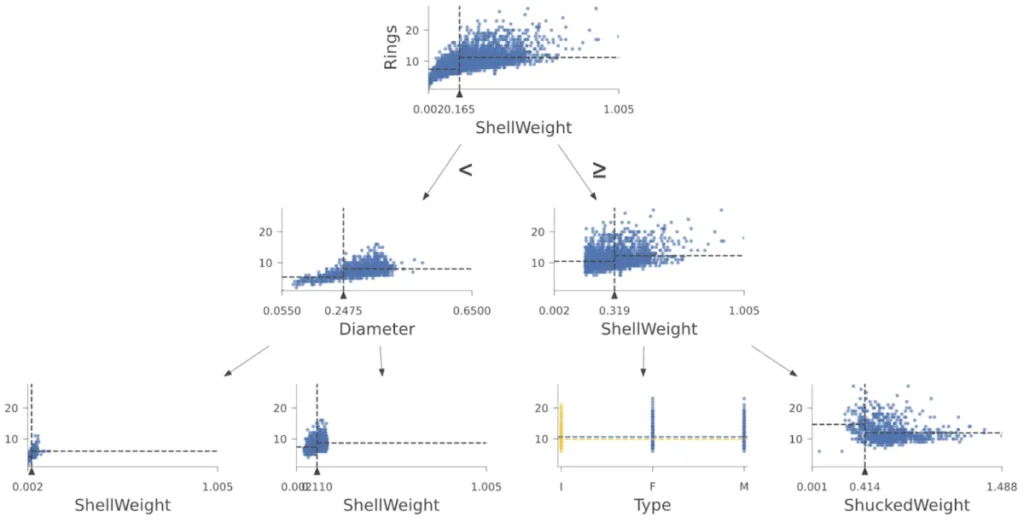
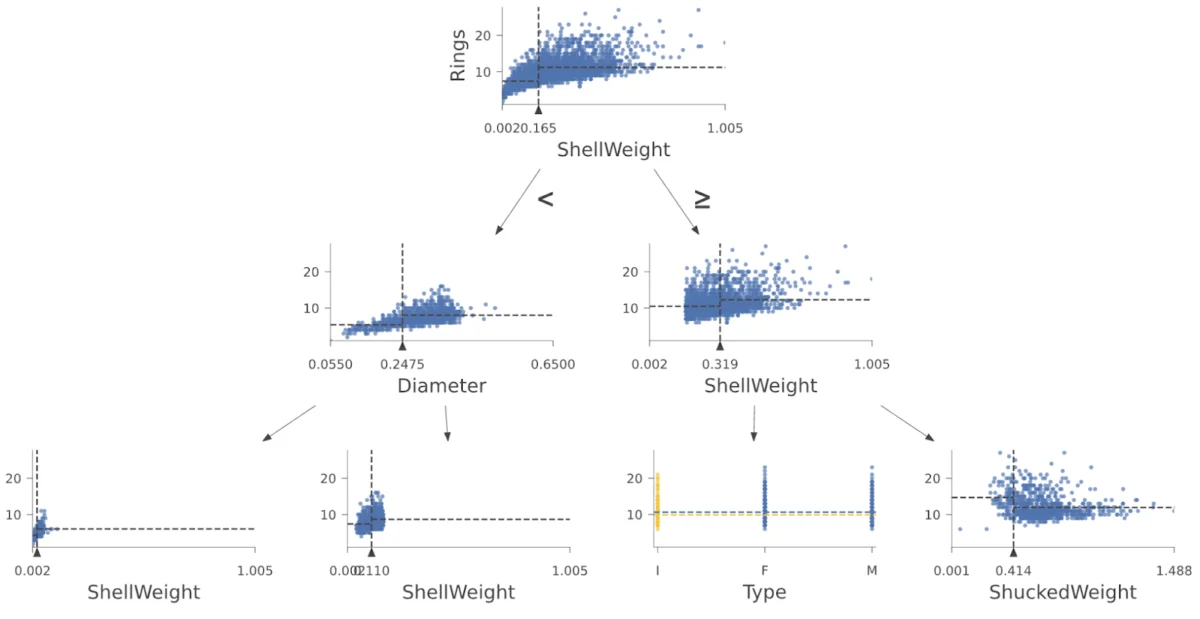
MOUNTAIN VIEW, Calif. — In the rapidly evolving landscape of artificial intelligence, transparency remains one of the most stubborn frontiers. While deep learning networks frequently operate as inscrutable "black boxes," tabular data models—specifically Random Forests and Gradient Boosted Trees—rely on a foundation that is theoretically explainable: the humble decision tree.
However, translating thousands of mathematical splits and decision nodes into human-comprehensible insights has long been a challenge for data scientists. Addressing this transparency gap head-on, Google and TensorFlow recently released a comprehensive new tutorial spotlighting dtreeviz, a state-of-the-art visualization library engineered to unlock, interpret, and render decision tree models in striking visual detail.
Published by Terence Parr of Google, the integration guide provides developers with a clear pathway to leverage dtreeviz alongside TensorFlow Decision Forests (TF-DF). By turning raw multi-dimensional data splits into intuitive, color-coded graphics, the tool aims to demystify how machine learning models arrive at critical predictions—ranging from medical diagnoses to financial credit approvals.
Main Facts: What is dtreeviz and Why Does It Matter?
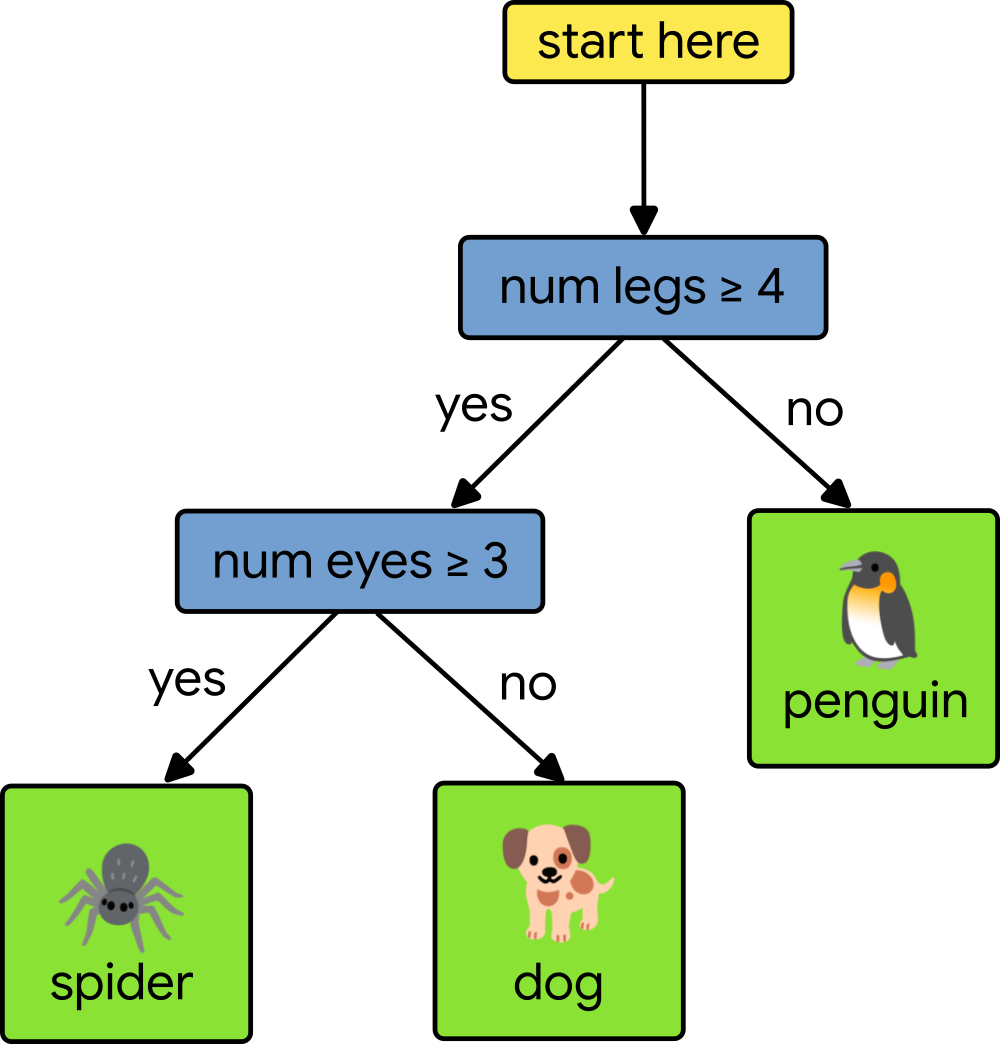
At its core, a decision tree is a supervised machine learning model that recursively splits training data based on feature thresholds, organizing observations into a hierarchical tree structure. Each internal node evaluates a single feature against a learned split point, while the terminal points—known as leaves—deliver the final prediction.

- Regression vs. Classification: In regression trees, leaf nodes predict continuous numerical values (such as housing prices or age). In classification trees, they output categorical labels (such as malignant versus benign tumors, or species identification).
- The Visualization Bottleneck: Traditional text-based outputs or rudimentary tree plots fail to display how training instances are distributed across feature spaces, making it difficult to understand why a model splits data at a specific threshold.
- The Solution: First introduced in 2018 by Terence Parr,
dtreevizhas evolved into the leading open-source visualization library for decision trees. It transforms complex vector logic into rich visualizations that display feature domain splits, training data distributions at every leaf, and the exact trajectory a single data point takes during inference.
The newly released TensorFlow tutorial bridges a critical gap, allowing developers building production-grade models via TensorFlow Decision Forests to seamlessly plug in dtreeviz for instantaneous model auditing and interpretability.
Chronology: The Evolution of Decision Tree Visualization
To understand the significance of the TensorFlow integration, it is helpful to trace the historical trajectory of decision tree tooling within the data science ecosystem.
The Era of Static Text and Basic Graphs (Pre-2018)
In the early decades of applied machine learning, data scientists relied on libraries like Scikit-Learn’s built-in text exporters or basic Graphviz integrations. These tools rendered tree structures as stark black-and-white node charts. While functional for tiny trees with two or three features, they completely failed when scaled to modern datasets involving dozens of features and thousands of samples. Developers could see that a split occurred at feature_x > 5.4, but they had no visual context regarding how that threshold separated the underlying data classes.
The Birth of dtreeviz (2018)
Recognizing the desperate need for human-centric ML visualization, Terence Parr developed dtreeviz. Built specifically to inject rich contextual data directly into the nodes and leaves of decision trees, the library quickly gained traction. Instead of abstract text, dtreeviz introduced stacked histograms, scatter plots, and density distributions inside the nodes themselves. This allowed engineers to visually assess whether a split was cleanly separating classes or merely overfitting noisy data.

The Community-Driven Expansion (2019–2022)
Over the next several years, the dtreeviz open-source community expanded rapidly. Developers contributed updates to support various tree-based libraries, including XGBoost, LightGBM, Scikit-Learn, and Spark MLlib. A robust community formed around troubleshooting via Stack Overflow, backed by deep-dive design articles and educational YouTube walkthroughs detailing the cognitive science behind effective data visualization.
The TensorFlow Integration (Present Day)
The release of the official TensorFlow tutorial marks a major institutional milestone. By formally integrating dtreeviz workflows with TensorFlow Decision Forests, Google is signaling a stronger industry commitment to model explainability. Data scientists can now train high-performance ensemble models at scale using TF-DF and immediately inspect individual constituent trees using the full analytical power of dtreeviz.
Supporting Data: Under the Hood of Tree Interpretability
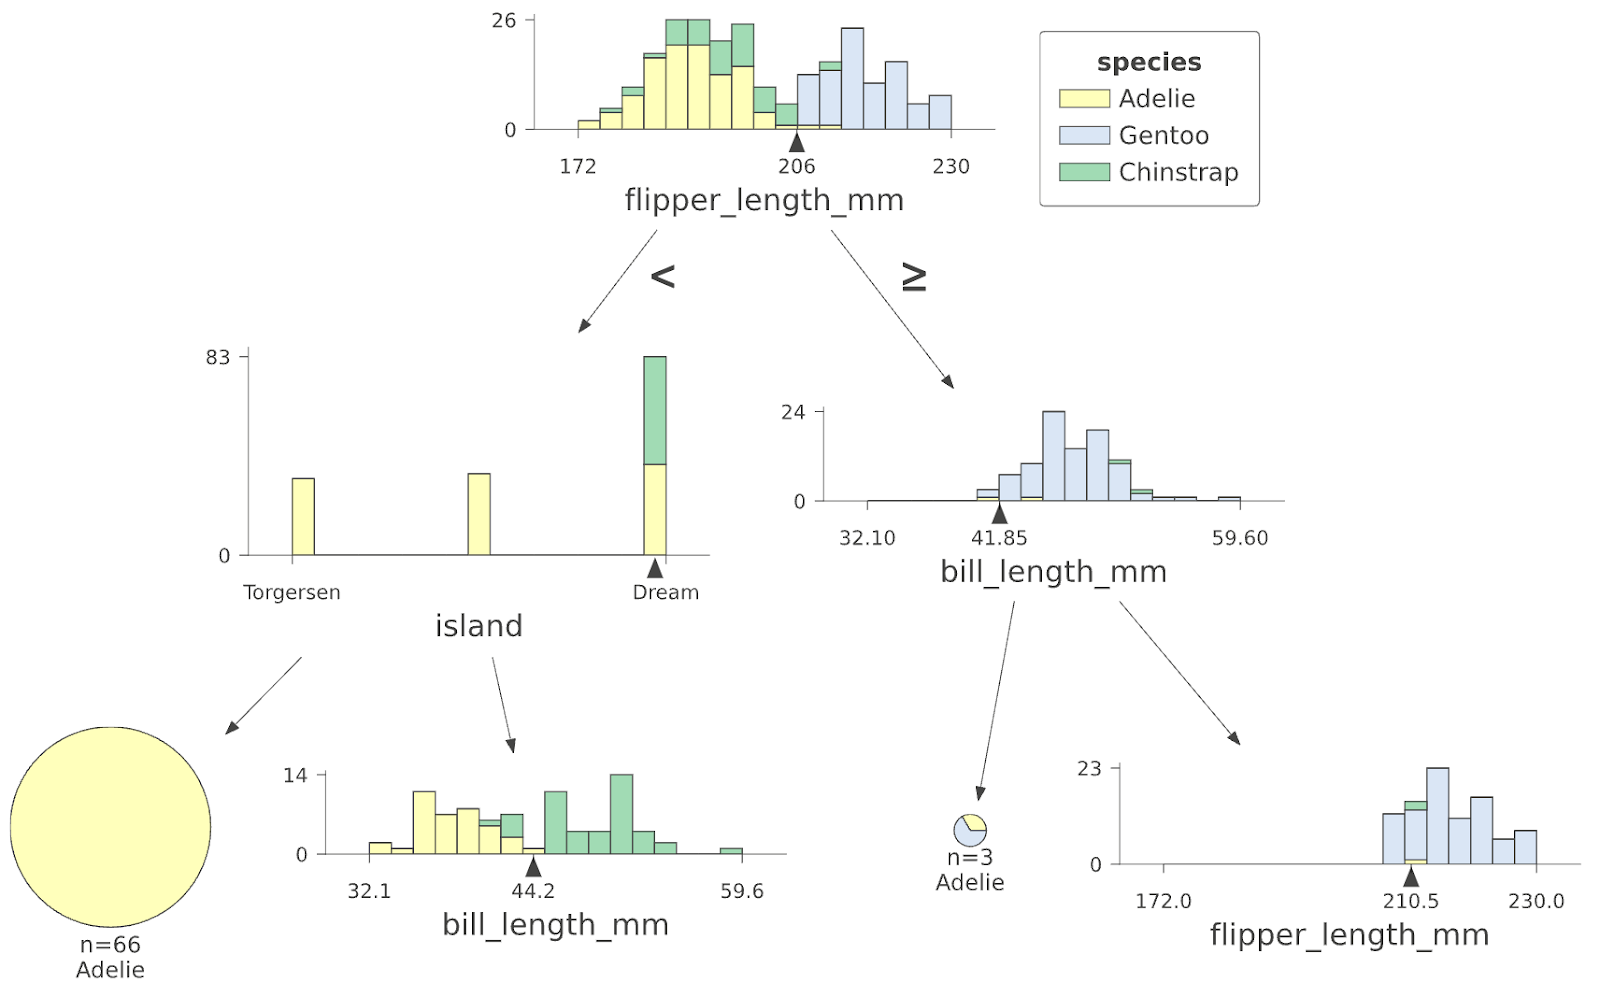
To demonstrate how the library operates in practice, developers can look at how dtreeviz handles multi-feature datasets. Consider a foundational classification example: the famous Palmer Penguins dataset.
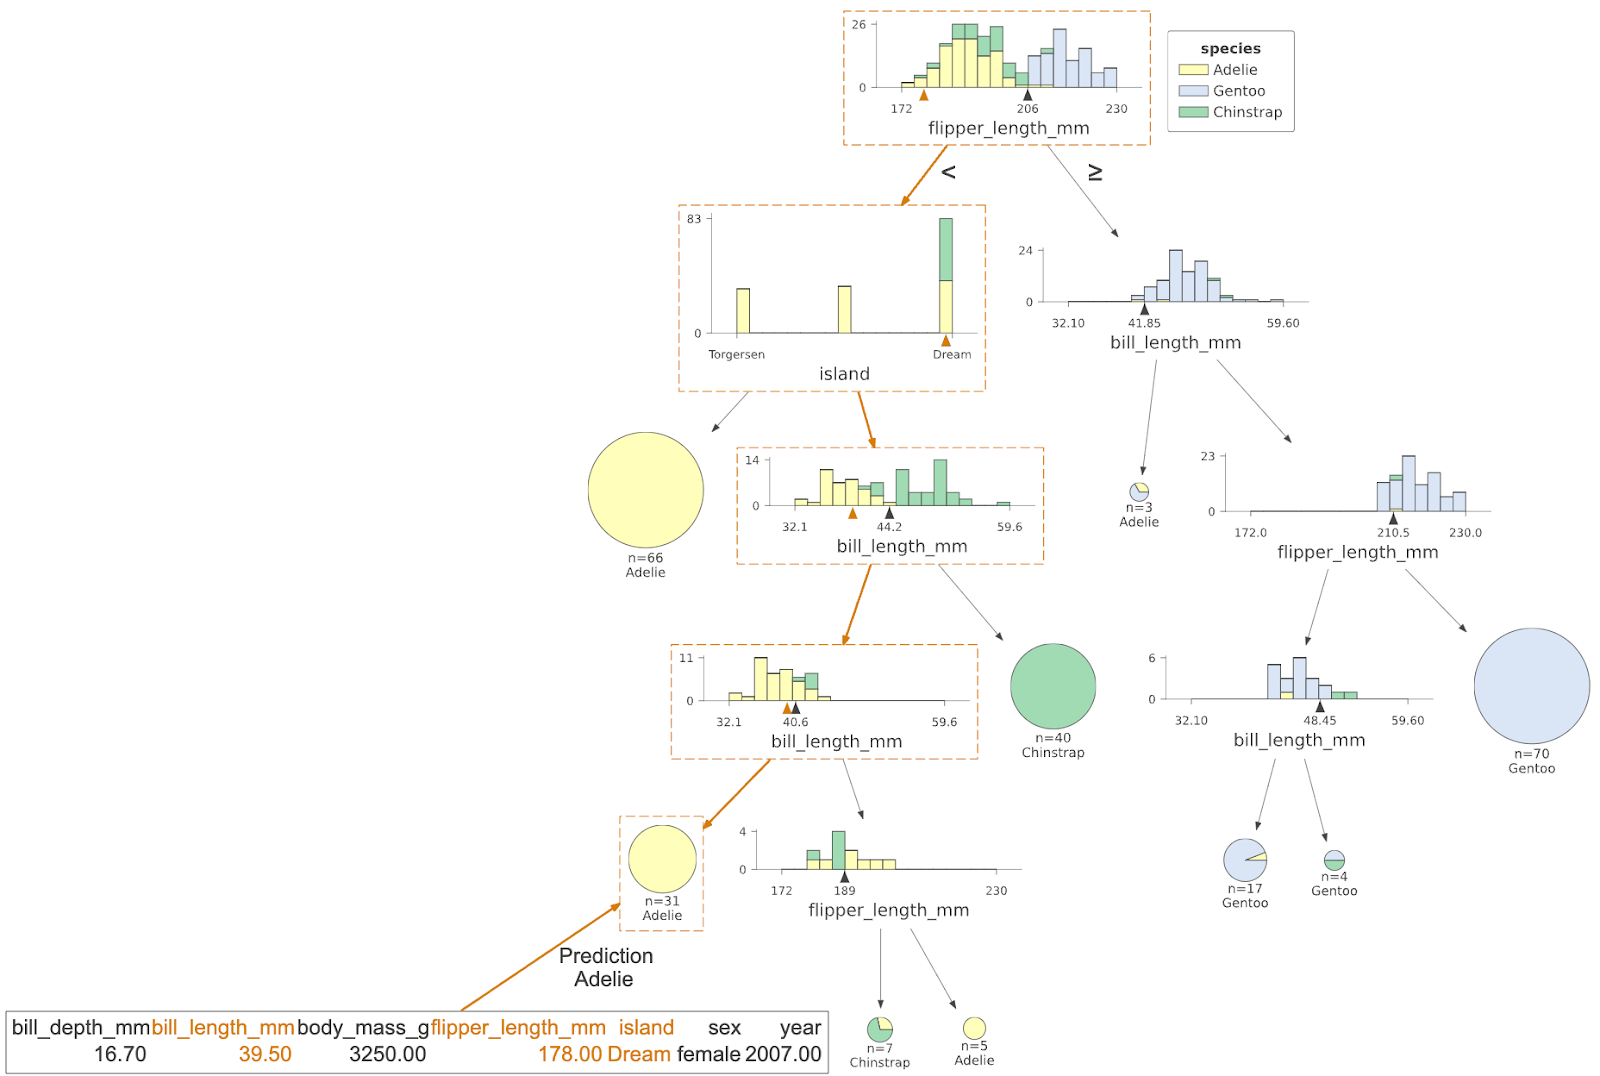
When training a Random Forest classifier to identify penguin species based on physiological characteristics, a generated tree might evaluate features such as flipper_length_mm, island, and bill_length_mm.
Using a remarkably concise snippet of Python code, a developer can instantiate the visualization object:
penguin_features = [f.name for f in cmodel.make_inspector().features()]
penguin_label = "species"  # Name of the classification target label

viz_cmodel = dtreeviz.model(
    cmodel,
    tree_index=3,  # pick specific tree from forest
    X_train=train_ds_pd[penguin_features],
    y_train=train_ds_pd[penguin_label],
    feature_names=penguin_features,
    target_name=penguin_label,
    class_names=classes,
)
viz_cmodel.view()
Visualizing Individual Inference Paths
Beyond viewing the macro-structure of a tree, dtreeviz excels at tracing micro-paths—the precise journey an individual test instance takes from the root node down to a final leaf.
If an automated system rejects a consumer’s bank loan application, for instance, stakeholders frequently demand to know the exact rationale. By highlighting the evaluation path in distinct orange boxes, dtreeviz allows auditors to pinpoint the precise thresholds that triggered the rejection—such as a credit score falling below a specific integer or a debt-to-income ratio exceeding tolerance limits.
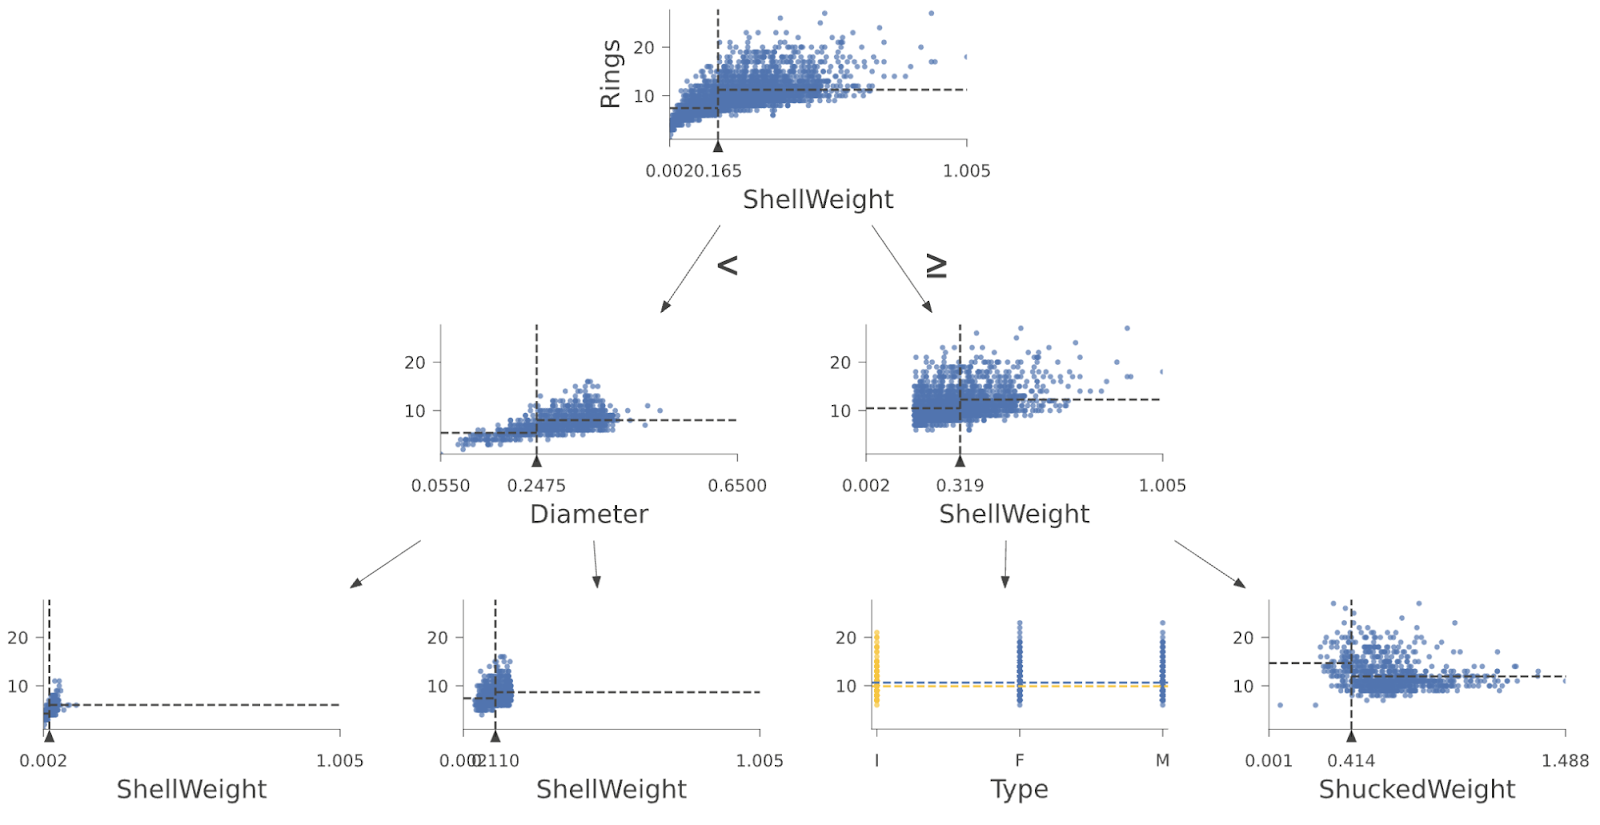
Furthermore, developers can audit leaf composition programmatically and visually. By calling methods like viz_cmodel.ctree_leaf_distributions(), data scientists can generate bar diagrams mapping Leaf IDs against samples-per-class. For regression tasks, the tool plots continuous target variable distributions (such as ring counts in the benchmark Abalone dataset), utilizing blue dots to display the exact spread of predicted values associated with each terminal leaf.
Official Responses and Industry Perspective
Industry leaders and machine learning researchers have long argued that predictive accuracy alone is insufficient for enterprise deployments. Models must be verifiable, transparent, and legally defensible.
In his documentation accompanying the release, Terence Parr emphasizes that visualization remains the absolute cornerstone of model debugging:
"To learn how decision trees work and how to interpret your models, visualization is essential. At a basic level, a decision tree learns the relationship between observations and target values by examining and condensing training data into a binary tree."
While Google has not mandated interpretability tools for all internal applications, the publication of tutorials bridging TensorFlow with specialized visualization libraries reflects a broader push toward "Responsible AI." By democratizing access to tools that expose internal model mechanics, tech giants are making it significantly easier for compliance officers, domain experts, and software engineers to interrogate automated decision-making systems before they impact end-users.
Implications: What This Means for Developers and Enterprises
The mainstream pairing of TensorFlow Decision Forests with dtreeviz carries several profound implications for the future of software development, machine learning engineering, and regulatory compliance.
1. Accelerated Model Debugging and Feature Engineering
Data scientists often spend weeks blindly tweaking hyperparameters when a model underperforms. By utilizing dtreeviz to visually inspect feature splits, engineers can immediately spot poorly performing features, redundant split points, or data leakage. Seeing data distributions split visually across nodes provides intuitive leaps that raw evaluation metrics (like accuracy or F1-scores) simply cannot match.
2. Meeting Regulatory Demands for Explainability
In heavily regulated sectors like finance, healthcare, and insurance, "black box" decisions can violate legal frameworks—such as the European Union’s General Data Protection Regulation (GDPR), which includes a conceptual "right to explanation." Tools that generate crystal-clear audit trails for tabular models make it vastly easier for organizations to comply with statutory mandates, ensuring that automated decisions affecting human lives can be thoroughly explained and justified.
3. Bridging the Communication Gap Between Technical and Non-Technical Stakeholders
Machine learning models often suffer from a communication barrier between data scientists and business leaders. While a data scientist interprets loss curves and confusion matrices, a business executive thinks in terms of customer segments and risk profiles. The rich, graphical nature of dtreeviz bridges this divide, allowing non-technical stakeholders to literally see the logic governing an AI system’s choices.
Next Steps for Practitioners
Developers eager to test the library can access the official TensorFlow Decision Forests dtreeviz tutorial via Google Colab. By applying the library to their own custom datasets, engineers can gain deeper intuition into how decision trees carve up multi-dimensional feature spaces, paving the way for more robust, interpretable, and trustworthy artificial intelligence applications.