Precision Engineering: How TensorFlow Lite Optimized Memory Management for Edge AI
In the rapidly evolving landscape of machine learning, the deployment of sophisticated models onto resource-constrained edge devices—such as mobile phones, IoT sensors, and embedded controllers—represents the final frontier of AI accessibility. While the core algorithms of machine learning are often the focus of academic research, the actual "on-device" performance relies heavily on the underlying runtime efficiency.
A recent technical breakthrough from the TensorFlow Lite (TFLite) engineering team has shed light on how granular performance profiling can unlock significant gains. By optimizing the memory arena—the system responsible for managing tensor buffers—engineers were able to slash runtime overhead by over 40%, ensuring that more compute cycles are dedicated to actual inference rather than memory management.
The Challenge of Edge-Device Inference
TensorFlow Lite is engineered to be lightweight, allowing complex neural networks to run on hardware with limited RAM and processing power. A critical component of this efficiency is the "memory arena," a mechanism that shares buffers between tensors to minimize the total memory footprint.

However, the team discovered that for models featuring dynamic input sizes or frequent re-allocations, the overhead of managing this arena could become a bottleneck. In some cases, the "bookkeeping" required to organize memory was consuming more than half of the total execution time, effectively cannibalizing the performance gains that developers seek when using TFLite.
Chronology of the Optimization Process
The optimization project was not a top-down rewrite, but a targeted, data-driven surgical strike on code efficiency. The process followed a rigorous methodology:
Phase 1: Identifying the Bottlenecks
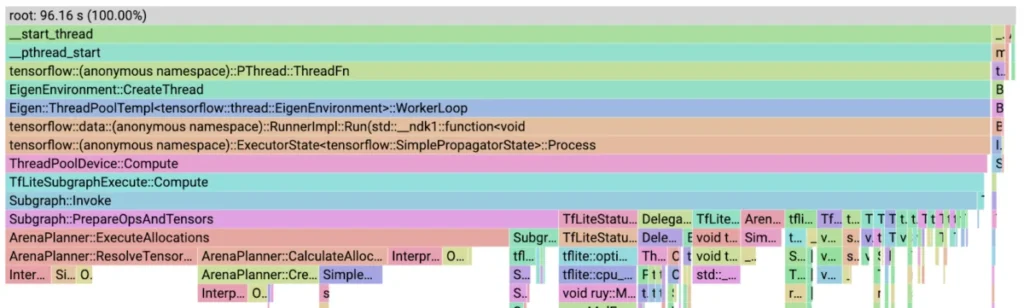
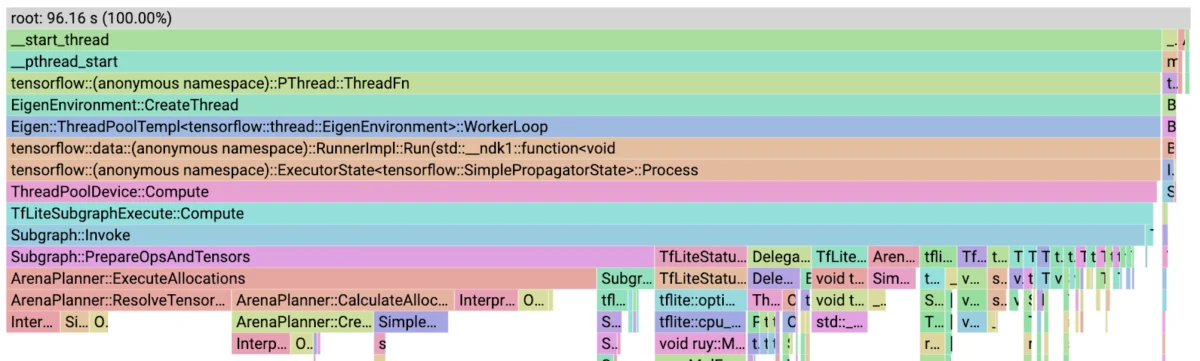
The engineering team employed Simpleperf, an Android-native performance profiling tool, to map the execution flow. By capturing call graphs and generating flame graphs, they could visualize exactly where the CPU was spending its time. The initial findings were counter-intuitive: instead of finding that heavy mathematical operations (like convolutions) were the culprit, the profile showed that ArenaPlanner::ExecuteAllocations accounted for a staggering 54.3% of the total runtime.

Phase 2: Caching and Reducing Virtual Calls
The first round of "low-hanging fruit" involved addressing excessive function calls. Profiling revealed that InterpreterInfo::num_tensors() was being called repeatedly inside a loop. Because this was a virtual function, the cumulative cost of these calls—combined with bounds checking in InterpreterInfo::tensor()—created significant drag. By caching the number of tensors and streamlining how pointers to the tensor array were retrieved, the team reduced the overall model runtime by 25% almost immediately.
Phase 3: Algorithmic Refinement
The team then focused on ArenaPlanner::CreateTensorAllocationVector. Previously, the code checked every tensor in the model to determine if it needed allocation between two nodes. By implementing a map-based look-up system that tracked allocations per node, the cost of this function plummeted from 4.8% of the runtime to a mere 0.8%.
Phase 4: Rethinking Deallocation
Perhaps the most significant victory occurred in the deallocation phase. Initially, SimpleMemoryArena::Deallocate used an $O(N^2)$ approach, frequently triggering expensive memcpy operations through std::vector::erase. By transitioning to a marking-and-sweeping strategy using std::remove_if and introducing a bulk DeallocateAfter(node) function, the team successfully eliminated the bottleneck.

Supporting Data: From Inefficiency to Streamlined Execution
The impact of these changes is best visualized through the shifting distribution of runtime cycles. Before the intervention, memory management consumed nearly 50% of the total inference cycle. Following the optimization, this overhead was reduced to roughly 6% of the runtime.
The team also tested alternative data structures, such as std::multimap, to see if they could improve upon the vector-based storage. Interestingly, they found that while std::multimap offers superior theoretical complexity for certain operations, the higher constant costs and the overhead of pointer chasing made it significantly slower than a simple, well-managed vector in this specific context. This serves as a vital reminder to engineers: theoretical complexity ($O$ notation) must always be balanced against the hardware-level reality of cache locality and constant-time overheads.
Official Engineering Insights
Alan Kelly, the Software Engineer leading the initiative, emphasized that these optimizations were not merely about code cleanup, but about fundamentally changing how the runtime interacts with the hardware.

"I was expecting to find that ML operators such as fully connected layers or convolutions to be the bottleneck of this model, and not runtime overhead," Kelly noted. "This is a particularly bad case; the memory arena overhead isn’t this bad for every model, but improvements here will impact all models."
By focusing on the "invisible" work—the management of pointers, the repeated calling of virtual functions, and the unnecessary iteration over active memory records—the team proved that the efficiency of an AI model is just as dependent on the software architecture as it is on the architecture of the neural network itself.
Implications for the Future of On-Device AI
The ripple effects of these optimizations are profound for the developer community. Because these changes were integrated into the core of TensorFlow Lite (starting with version 2.13), they benefit a vast ecosystem of applications without requiring developers to change their model architectures.

The "Flame Graph" Methodology
The success of this project highlights the necessity of robust profiling tools. The use of Simpleperf combined with pprof (a visualization tool for profiling data) allows developers to:
- Visualize Bottlenecks: Identify "hot paths" where the CPU spends the most time.
- Annotate Code: Correlate assembly instructions with high-level source code to understand why a specific operation is expensive.
- Validate Changes: Use iterative profiling to ensure that an optimization in one area does not inadvertently create a bottleneck elsewhere.
The Standard for Performance
The goal of any inference engine should be for the "useful" work—the mathematical computation of neural network layers—to represent the vast majority of the execution time. By reducing the overhead of the memory arena to a single-digit percentage, the TFLite team has set a new standard for runtime performance.
For developers building the next generation of augmented reality, real-time speech recognition, or autonomous vision systems, this means that the "budget" for model complexity has effectively increased. A model that was previously deemed too slow for a low-power mobile processor may now be viable, simply because the runtime itself has become more efficient.

Conclusion: Lessons for the Developer Community
The journey of the TFLite team serves as a masterclass in software engineering. By moving away from assumptions and relying on the objective data provided by profiling tools, they were able to optimize a system that was already considered "fast."
As AI models continue to grow in size and complexity, the efficiency of the underlying runtime will become the defining factor in what is possible on the edge. The improvements made to the TFLite memory arena are a reminder that in software, as in neural networks, the most impactful optimizations are often found by looking at the connections—the infrastructure that holds the system together. Developers are encouraged to adopt similar profiling habits, utilizing tools like Simpleperf to ensure their own pipelines are as lean and efficient as the models they deploy.