The Elusive Metric of Modern Connectivity: Demystifying Internet Speed Tests


In an era where digital life intertwines inextricably with our daily routines, the speed of our internet connection has become a modern-day performance benchmark. Much like car enthusiasts obsess over quarter-mile times or weightlifters strive for an extra plate on the bar, internet users meticulously scrutinize the results of their latest speed test. The ritual is familiar: close extraneous browser tabs, click the prominent "Go" button, and watch the digital needle climb, offering a fleeting glimpse into the perceived prowess of one’s network.
A user paying for gigabit service might see a gratifying 940 megabits per second (Mbps), eliciting a satisfied nod. Conversely, a reading of 299 Mbps could trigger an immediate, almost obsessive, dive into network hardware diagnostics. Yet, before any premature celebration or consternation, a simple re-run of the test often reveals a different answer. This variability is not necessarily indicative of a "lying" test; rather, it underscores a fundamental truth: "Internet speed" is not a singular, immutable physical quantity waiting to be measured. It is a dynamic, multifaceted performance snapshot, influenced by a complex interplay of factors that make each test a unique measurement.
Beyond the Needle’s Climb: Understanding Test Variability
At its core, an internet speed test measures the performance of a specific device, traversing a particular local connection, through a distinct Internet Service Provider (ISP) route, to a chosen server, at a precise moment, utilizing a specific testing methodology. Alter any of these variables – the device, the Wi-Fi signal, the network cable, the time of day, or the test server – and the resulting speed can, and often will, change dramatically. This inherent variability is crucial to understanding why one test result rarely mirrors another, and why interpreting these numbers requires a deeper dive into their underlying mechanics.
The Pantheon of Speed Tests: Methodologies and Motivations
The landscape of internet speed testing is populated by several prominent tools, each employing distinct methodologies tailored to measure different aspects of network performance. Understanding these differences is key to making sense of the often-disparate results.
Ookla Speedtest: The Aggregate Bandwidth Champion
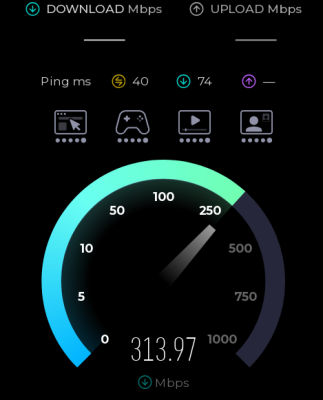
Perhaps the most widely recognized name in internet speed testing, Ookla’s Speedtest.net, serves as the de facto standard for many consumers. Its popularity stems from its intuitive interface and its approach to measuring aggregate bandwidth. Ookla typically auto-selects a nearby server, though users retain the option to choose another. The test then attempts to "saturate" the connection by initiating multiple simultaneous data transfers. This multi-stream approach is particularly effective at answering the question most consumers pose: "Approximately how much total bandwidth can this internet connection deliver?"
The strategy of running several parallel connections is critical. A single Transmission Control Protocol (TCP) connection must gradually increase its sending rate, reacting to factors like round-trip time (RTT), packet loss, receive-window limits, and congestion-control behaviors. On high-bandwidth or high-latency paths, a lone connection may struggle to fully utilize the available "pipe." By contrast, multiple parallel connections can ramp up independently, making it easier to collectively reach the link’s maximum aggregate capacity. While this reported number is valid, it represents a scenario akin to a busy household with multiple devices streaming, a large segmented download, or several applications operating concurrently. It does not necessarily predict the speed of a single file transfer from one distant server, which might be limited by the constraints of a single TCP stream.
Measurement Lab (M-Lab) NDT: Probing Single-Stream Capacity
In contrast to Ookla’s multi-stream approach, Google’s built-in search speed test (accessible by simply searching "speed test") leverages Measurement Lab’s Network Diagnostic Tool (NDT). M-Lab describes NDT as a single-stream measurement of "bulk-transport capacity." This makes it an interesting counterpoint to Ookla, as a single data flow is more likely to expose underlying network limitations such as latency, packet loss, or TCP-window constraints that a multi-stream test might partially conceal. Users can also access M-Lab’s own speed test directly via speed.measurementlab.net.
While users might occasionally observe similar numbers between Ookla and M-Lab, significant discrepancies are common, particularly on high-latency connections. In such scenarios, Ookla’s multiple streams can effectively "hide" the impact of latency by keeping the pipe full, whereas NDT’s single stream will directly reflect the limitations imposed by the RTT and other single-flow characteristics.
Netflix’s Fast.com: Real-World Streaming Performance
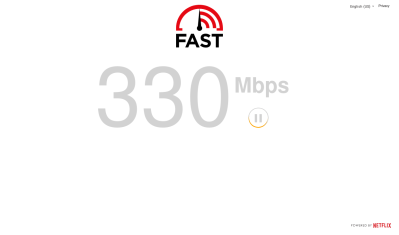
Netflix’s Fast.com embodies deliberate simplicity. Opening the page immediately triggers data transfer from Netflix’s global infrastructure. By default, it prioritizes download performance, a design choice rooted in its original purpose: to answer the practical question, "Can this connection reliably deliver Netflix video?" For those seeking more detail, selecting "Show more info" reveals upload speed, as well as unloaded and loaded latency.
The use of Netflix’s own servers is a significant differentiator. Fast.com specifically measures the route between the user and Netflix’s vast content-delivery network (CDN). This contrasts with Ookla, which might test against a server operated by the user’s ISP, potentially only a few network hops away. A stellar Ookla result coupled with a poor Fast.com result doesn’t automatically imply deliberate throttling by the ISP. Instead, it strongly suggests that the network destinations—or the routes leading to them—are behaving differently, providing crucial insight into real-world application performance.

Cloudflare’s Detailed Diagnostics: Unpacking Connection Quality
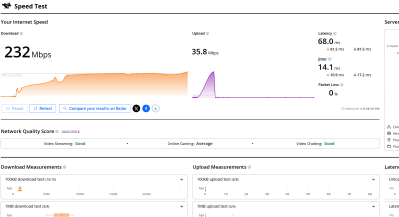
Cloudflare, a major player in internet infrastructure, offers two related and highly informative tests. Its Radar Network Quality Test provides a quick, high-level summary, while speed.cloudflare.com delivers an exceptionally detailed breakdown of connection quality. The latter reports not only download and upload throughput but also crucial metrics such as idle and loaded latency, jitter, packet loss, server location, and even application-oriented quality estimates.
Loaded latency is an especially valuable metric. An internet connection that appears fast in ideal conditions can become frustratingly sluggish when subjected to significant upload or download traffic, which can fill an oversized buffer (queue) in the modem or router. A pristine idle ping of 12 milliseconds might balloon to several hundred milliseconds under load, a classic symptom known as "bufferbloat." Cloudflare’s detailed analysis helps users diagnose such issues, which can severely impact interactive applications like online gaming or video conferencing, even on a nominally "fast" connection.
Other Contenders: Testmy.net and Speedof.me
Beyond these major players, other speed test services offer specialized features. Testmy.net allows users to test upload and download speeds independently, providing a more granular view. Speedof.me distinguishes itself by keeping a history of past test results, enabling users to track performance trends over time. When exploring these or other lesser-known services, it’s not always immediately apparent whether they employ single or multiple connections for their measurements. Users may need to consult available documentation to understand the specific methodology and context of the results.
The Local Battlefield: When Your Wi-Fi Becomes the Bottleneck
While many immediately suspect their ISP when speed tests disappoint, the bottleneck often lies much closer to home: within the local network, particularly Wi-Fi. A browser speed test, by its nature, cannot automatically distinguish between an ISP issue and a local network limitation. A laptop connected via a marginal Wi-Fi signal might report a mere 180 Mbps, even if the router is receiving a flawless gigabit internet connection.
The Disconnect Between Link Rate and Throughput
Indeed, once incoming internet service surpasses several hundred Mbps, Wi-Fi frequently becomes the primary limiting factor. It’s critical to understand that the "link rate" displayed by an operating system (e.g., 866 Mbps, 1200 Mbps, or 2400 Mbps) is not synonymous with usable application throughput. Wireless protocols are inherently less efficient than wired connections, burdened by framing overhead, acknowledgments, contention among devices, retransmissions of lost packets, and half-duplex operation (meaning a device can either send or receive at any given moment, but not both simultaneously). Consequently, the advertised physical (PHY) link rate is a theoretical maximum and not a promise of actual data transfer speed.
Deciphering Wi-Fi Marketing Jargon
Adding another layer of optimism, the numbers printed on Wi-Fi router boxes often misrepresent real-world capabilities. A router marketed as "AC1800," for example, does not provide an 1800 Mbps connection to a single device. This figure is typically the sum of the maximum advertised PHY rates across separate radios – perhaps 1300 Mbps on the 5 GHz band plus 450 Mbps on the 2.4 GHz band, often rounded for marketing purposes. A conventional Wi-Fi client connects to only one band at a time and therefore cannot combine these rates. The "total" is better understood as the router’s theoretical aggregate capacity when serving multiple devices across both bands simultaneously. Even then, protocol overhead, contention, signal quality, and client-side limitations conspire to make actual data throughput considerably lower. While newer Wi-Fi 7 equipment introduces advanced features like Multi-Link Operation (MLO) that can sometimes combine links, this exception does not negate the misleading nature of the older ACxxxx arithmetic.
The Shared Airtime Challenge
Wi-Fi operates on shared airtime. All devices on the same channel – including neighboring access points that can "hear" one another – must contend for opportunities to transmit data. A slow or distant client, requiring more time to send a given amount of data, can disproportionately consume available airtime, reducing the overall capacity for other, faster devices. While modern access points often incorporate "airtime fairness" and other mitigation techniques, a single older device can still negatively impact the network’s collective performance. Interference has a similar debilitating effect. A weak signal, a crowded channel (common in apartment buildings), microwave oven noise, or an overlapping neighboring Wi-Fi network can cause data frames to be delayed or require retransmission. These retries consume valuable airtime without delivering additional data, directly reducing effective throughput.
The Complication of Wireless Repeaters and Mesh Networks
The use of Wi-Fi repeaters or wireless mesh backhaul introduces further complications. A simple, same-channel repeater must receive each packet and then re-transmit it over the same shared medium. In the worst-case scenario, each repeated hop can roughly halve the available throughput. More advanced tri-band mesh systems can significantly mitigate this penalty by dedicating a separate radio for backhaul communication between mesh nodes. Furthermore, utilizing Ethernet cabling for backhaul between mesh nodes or access points avoids this wireless overhead almost entirely, offering the most robust performance.
Given these complexities, it is entirely reasonable for a user paying for gigabit internet service to obtain only 300 or 500 Mbps from a Wi-Fi-connected laptop. Whether this represents a "problem" depends on a multitude of factors: the client device’s capabilities, the radio band being used (2.4 GHz vs. 5 GHz), the channel width, the signal level, the backhaul method, and the prevailing local radio frequency (RF) environment. For a meaningful test of ISP performance, it is crucial to begin with a computer connected directly to the router via Ethernet. Temporarily disable any large transfers and VPNs. Record the chosen server, latency, upload speed, and download speed, rather than selectively saving only the most flattering numbers. Subsequently, run the identical tests over Wi-Fi. The difference between these two sets of results provides an approximate measurement of the performance "cost" imposed by the wireless portion of the network.
Diagnosing Beyond the ISP: Local Network Testing Tools
To truly pinpoint network bottlenecks, it’s often necessary to remove the ISP from the experiment entirely and focus on the local area network (LAN).
OpenSpeedTest: Self-Hosting for Internal Network Insight
OpenSpeedTest offers a self-hostable, browser-based testing solution. By running its server component on a wired computer, Network Attached Storage (NAS) device, or a container within your local network, users can then visit its web interface from laptops, phones, and tablets throughout their home. Because all traffic remains confined to the LAN, a slow result unequivocally points toward issues with Wi-Fi, switching, cabling, or the client device itself, rather than the internet connection.
It’s even possible to run OpenSpeedTest on the uhttpd server commonly used with OpenWRT, a popular open-source router firmware. However, coaxing it to measure upload speeds can require a specific configuration, often involving the creation of a CGI script designed to successfully accept a large volume of data, and then configuring uhttpd to execute it. This allows for detailed local network diagnostics even on resource-constrained devices.
iperf3: The Professional’s Choice for Network Benchmarking
For serious network diagnosis, it is hard to surpass iperf3, a powerful client/server command-line tool. As recently demonstrated in testing mesh routers, iperf3 provides granular control over network traffic and offers precise measurements.
To use iperf3, one machine (e.g., with IP address 192.168.1.100) is designated as the server:
iperf3 -sFrom another machine, the client connects to the server to initiate a test:
iperf3 -c 192.168.1.100By default, iperf3 utilizes a single TCP connection. However, its versatility allows for variations that yield crucial diagnostic information. Adding -P 4, for example, instructs iperf3 to use four parallel streams. If four streams produce significantly faster results than a single stream, it suggests that the network possesses sufficient aggregate capacity, but individual TCP flows are being limited by factors such as latency, packet loss, TCP window growth, CPU performance, or network offload behavior. Conversely, using -R reverses the direction of the test, so the server sends data and the client receives. If the reverse test is substantially faster, it warrants an examination of the weaker machine’s transmit path, drivers, antennas, or CPU.
Beyond TCP throughput, iperf3 can also generate User Datagram Protocol (UDP) traffic at a specified rate, reporting critical metrics like packet loss and jitter. For evaluating wireless links, which are often susceptible to these issues, UDP testing can be far more informative than merely chasing the largest TCP throughput number, as it reveals the quality and reliability of the connection for real-time applications.
Advanced Tuning: Can Linux Boost Your Network Performance?
Linux, with its highly configurable kernel, offers an impressive array of network tuning knobs, naturally tempting advanced users to tweak settings in pursuit of optimal performance. However, effective tuning first requires a clear understanding of the underlying problem.
Initial Diagnostics: Ethernet, Errors, and Retransmits
Before delving into complex configurations, fundamental diagnostics are essential. Checking the negotiated Ethernet rate and interface counters provides vital clues:
ethtool eth0
ip -s link show eth0
If a gigabit Ethernet adapter is negotiating at only 100 Mbps, the problem is almost certainly physical – a faulty cable, a poor connector, or a misconfigured switch port. In such cases, increasing TCP buffers will not magically fix the issue. Similarly, rising interface errors and drops point toward a physical layer problem, a driver malfunction, or congestion within the immediate network segment. TCP retransmits, viewable with ss -ti during an active transfer, are indicators of packet loss occurring somewhere along the path.
Queue Disciplines and Bufferbloat Mitigation
The active queue discipline (qdisc) can be inspected with:
tc qdisc showLinux supports advanced queue disciplines such as fq_codel (Fair Queueing with Controlled Delay), which combines per-flow queueing with active queue management. Its purpose is to prevent a single large transfer from monopolizing the buffer and creating an enormous queue that delays unrelated, interactive packets. The kernel documentation specifically recommends fq_codel as a sensible, performant queue discipline that often works well without extensive manual configuration.
It can be set as the default for newly created interfaces with:
sudo sysctl -w net.core.default_qdisc=fq_codelWhile this can improve queueing behavior for traffic originating from the Linux machine, it will not, however, remedy a large queue residing in the cable modem or the primary internet router. Queue management must be applied at the bottleneck. If the ISP link is limited to 20 Mbps upstream, controlling a queue on a gigabit Ethernet interface after packets have already been handed off to the router is too late; the bufferbloat has already occurred upstream. For a typical home connection, the most effective bufferbloat treatment is usually Smart Queue Management (SQM) implemented directly on the router. OpenWrt’s SQM system supports both fq_codel and CAKE, with CAKE generally providing superior performance in reducing latency under load, albeit with slightly higher CPU overhead compared to fq_codel.
TCP Congestion Control: Optimizing for Latency and Loss
High-latency network paths introduce a different set of challenges. TCP must maintain enough data "in flight" to fully utilize the bandwidth-delay product of the connection. Modern Linux kernels generally employ autotuning for TCP buffers, making the old advice of assigning enormous fixed values to tcp_rmem (receive memory) and tcp_wmem (write memory) less universally applicable. Before altering these settings, use ss -ti during a transfer to inspect retransmissions, round-trip time, congestion-window size, and to determine if the receiver window is genuinely limiting the connection.
Linux also supports selectable TCP congestion-control algorithms:
sysctl net.ipv4.tcp_available_congestion_control
sysctl net.ipv4.tcp_congestion_control
Algorithms such as BBR (Bottleneck Bandwidth and RTT) can significantly improve throughput and queue behavior on certain long-distance or lossy paths by more intelligently probing for available bandwidth and managing congestion. However, changing the algorithm only affects connections initiated by that specific Linux machine. It does not control the remote speed-test server, repair poor Wi-Fi, or eliminate a queue in the router. Therefore, congestion-control tuning is a valuable experiment for a server, a VPN endpoint, or a machine performing long-haul data transfers, but it is not a universal solution for general networking slowdowns.
Hardware Offload Features
Finally, when a Linux system struggles to keep pace with a fast LAN, it’s worth inspecting hardware offload features:
ethtool -k eth0These features, such as large receive offload (LRO) or generic receive offload (GRO), can shift processing tasks from the CPU to the network interface card (NIC), potentially improving performance. However, in some rare cases, they can introduce compatibility issues or mask problems, so careful testing is advised. Advanced network tuning is a deep rabbit hole, and extensive guides exist for those wishing to explore it further.
Official Responses and Industry Perspectives
The variability and complexity of internet speed measurement are acknowledged by both Internet Service Providers and the companies that develop speed testing tools.
ISP Disclaimers: ISPs typically advertise "up to" speeds, signifying the maximum theoretical bandwidth available under ideal conditions. Their service level agreements (SLAs) often specify that actual speeds may vary due to factors beyond their direct control, such as customer equipment (modems, routers), in-home wiring, Wi-Fi conditions, server load at the destination, and network congestion. They generally frame their responsibility as delivering the promised bandwidth to the customer’s modem or gateway, with the internal network being the customer’s purview.
Test Provider Methodologies: Speed test providers like Ookla, M-Lab, Fast.com, and Cloudflare are transparent about their methodologies. They emphasize that each test is designed to measure specific aspects of network performance, often with different goals in mind. For instance, Ookla focuses on aggregate throughput, M-Lab on single-stream capacity, and Fast.com on streaming viability. They encourage users to understand these differences to interpret results accurately, often providing documentation that explains their server selection, connection types, and the metrics they prioritize. Their "official response" is typically one of user education, highlighting that no single test provides a definitive "truth" but rather a snapshot from a particular vantage point.
Regulatory Considerations: The complexity of speed measurement also has implications for regulatory bodies, particularly in discussions around net neutrality and truth in advertising for internet speeds. Regulators often rely on a combination of testing methodologies and consumer complaints to assess whether ISPs are delivering advertised services or engaging in practices like traffic shaping. The ongoing challenge is to establish standardized, robust, and transparent methods for measuring and reporting internet performance that fairly represent the user experience.
Implications for Users and the Future of Connectivity
The nuanced understanding of internet speed tests carries significant implications for various stakeholders.
For Consumers: Empowered with knowledge, consumers can make more informed decisions when choosing an ISP package, troubleshoot their home networks effectively, and set realistic expectations for their internet performance. Understanding the difference between ISP-side and local network issues allows them to address problems more efficiently, whether by upgrading their Wi-Fi router, optimizing its placement, or contacting their ISP with specific, well-diagnosed concerns. It also enables them to critically evaluate service level agreements and challenge discrepancies between advertised and actual performance.
For Network Administrators: For network administrators in businesses or institutions, a deep understanding of these testing methodologies and diagnostic tools is indispensable. It allows them to pinpoint bottlenecks, optimize network infrastructure, and perform capacity planning with greater accuracy. They can use tools like iperf3 to benchmark internal network segments, identify failing hardware, or validate Quality of Service (QoS) configurations, ensuring critical applications receive the necessary bandwidth and low latency.
Future Trends: As internet demands continue to evolve with bandwidth-intensive applications like 4K/8K streaming, virtual and augmented reality (VR/AR), and cloud gaming, the need for more sophisticated and comprehensive QoS measurements will grow. Future speed tests may incorporate even more granular metrics related to application-specific performance, adaptive testing that simulates real-world usage patterns, and integrated diagnostic capabilities that automatically identify common bottlenecks. The emphasis will shift further from a single, raw speed number to a holistic assessment of connection quality and reliability for diverse digital experiences.
The True Measure of Speed: Performance in Practice
The lesson is clear: there is no universally correct, singular internet speed test result. Ookla gauges the effectiveness of multiple transfers filling a route to one of its servers. M-Lab examines a single bulk flow. Fast.com assesses the path to Netflix’s content delivery. Cloudflare provides an unparalleled deep dive into latency under load and overall connection quality. And local tools like OpenSpeedTest and iperf3 are instrumental in determining whether the internet connection itself is even the root of a performance problem.
Running enough tests across various platforms will almost certainly yield a number impressive enough to brag about. However, running the right tests, with a critical understanding of what each measures, is what truly empowers users to identify bottlenecks and implement changes that genuinely enhance real-world performance. While the desire to chase every last kilobit per second is an understandable impulse for many tech enthusiasts – and indeed, we empathize with that pursuit – the ultimate truth remains: if your internet connection reliably does what you need it to do, when you need it to do it, then it is, in fact, fast enough. The true measure of speed is not the number on a screen, but the seamlessness of your digital life.