Decoding the Black Box: How dtreeviz is Revolutionizing Decision Tree Interpretability
In the evolving landscape of artificial intelligence, the "black box" nature of machine learning models remains one of the most significant hurdles for practitioners and stakeholders alike. While models like Gradient Boosted Trees and Random Forests are the industry gold standard for tabular data, understanding exactly how they arrive at a prediction is often shrouded in complexity.
Google’s recent integration of dtreeviz—a state-of-the-art visualization library—into the TensorFlow Decision Forests ecosystem marks a pivotal shift toward transparency. By providing a clear, visual roadmap of decision logic, this tool allows data scientists to move beyond blind trust in their models, fostering a new era of explainable AI (XAI).
The Fundamentals: Why Decision Trees Matter
Decision trees serve as the foundational architecture for the most robust machine learning models used in tabular data analysis. At their core, these models mimic a human-like decision process: they ingest vast amounts of training data and condense it into a structured, binary tree format.

Every leaf node in these trees acts as a decision point. In regression tasks, a leaf produces a continuous value, such as a projected stock price or a product cost. In classification tasks, it identifies a categorical outcome—for instance, determining if a medical scan indicates a benign or malignant condition.
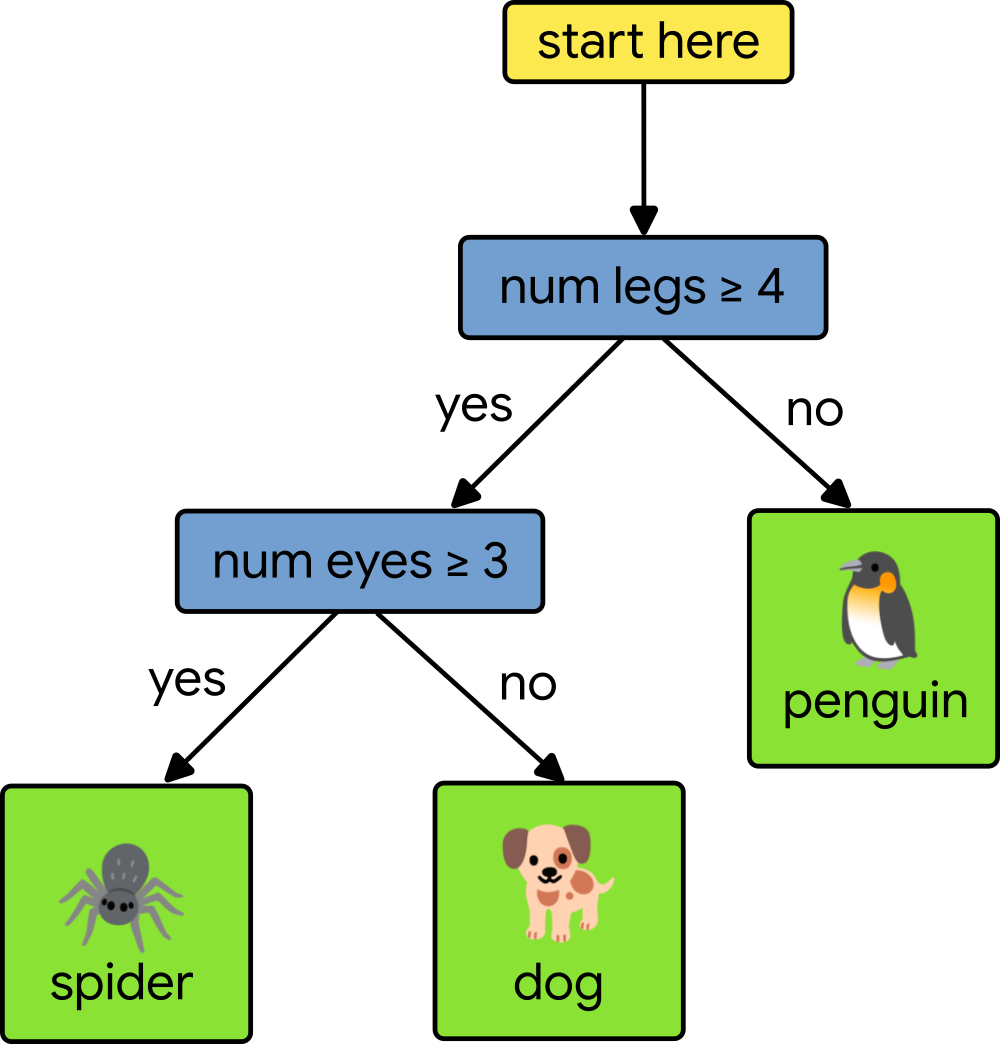
The mechanism is deceptively simple: to make a prediction, the model travels from the root down through internal decision nodes. Each node performs a test, comparing a specific feature’s value against a learned split point. This path continues until the model reaches a leaf, producing the final inference. While mathematically sound, the sheer volume of these trees in a Random Forest makes them impossible for humans to parse manually. This is where dtreeviz enters the narrative.
A Chronology of Visualization Innovation
The journey toward better interpretability has been iterative. For years, the data science community relied on basic, static text-based tree dumps or simple plot functions that lacked the granularity required for deep debugging.

- 2018: The initial release of dtreeviz arrived as a breakthrough, providing the first high-fidelity, interactive, and visually intuitive way to represent tree logic.
- 2019–2022: As the open-source community rallied behind the tool, it underwent continuous updates, refining how it handled complex distributions and high-dimensional feature spaces. It became the go-to utility for practitioners on platforms like Stack Overflow.
- The Present Day: TensorFlow’s official endorsement and the publication of a dedicated tutorial have institutionalized the library. This integration allows TensorFlow Decision Forest users to plug into dtreeviz seamlessly, bridging the gap between high-performance modeling and human-readable insights.
Supporting Data and Technical Implementation
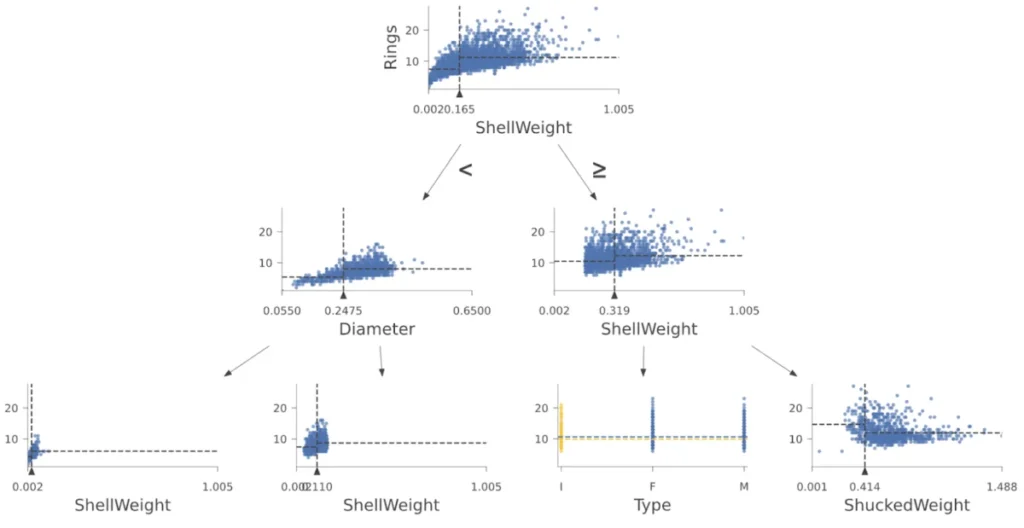
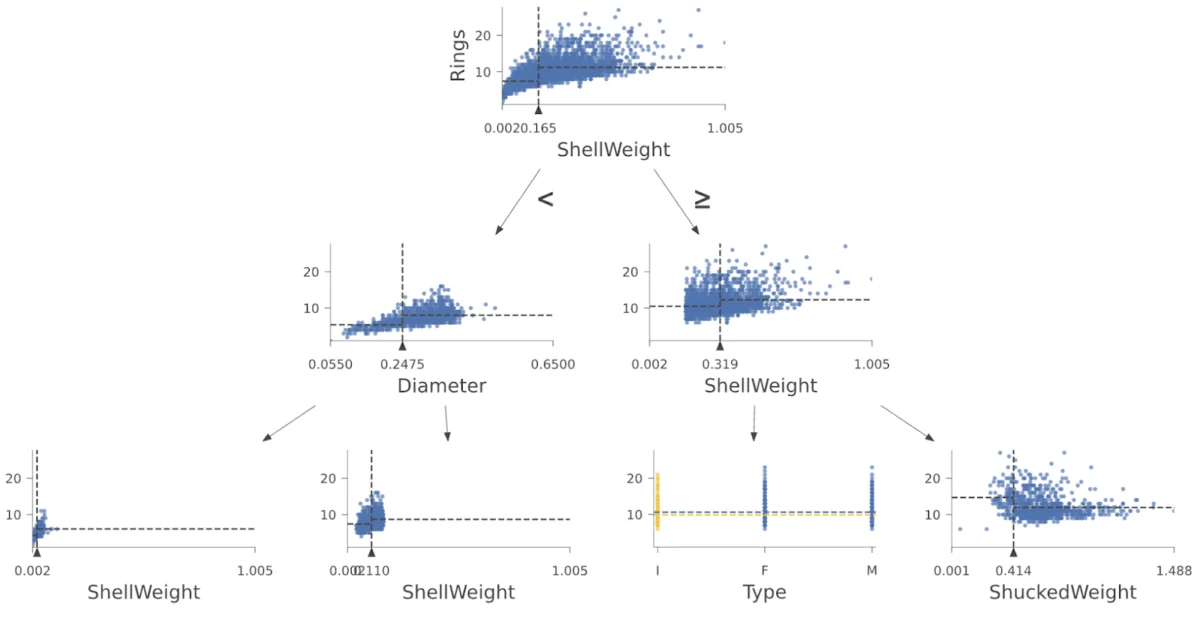
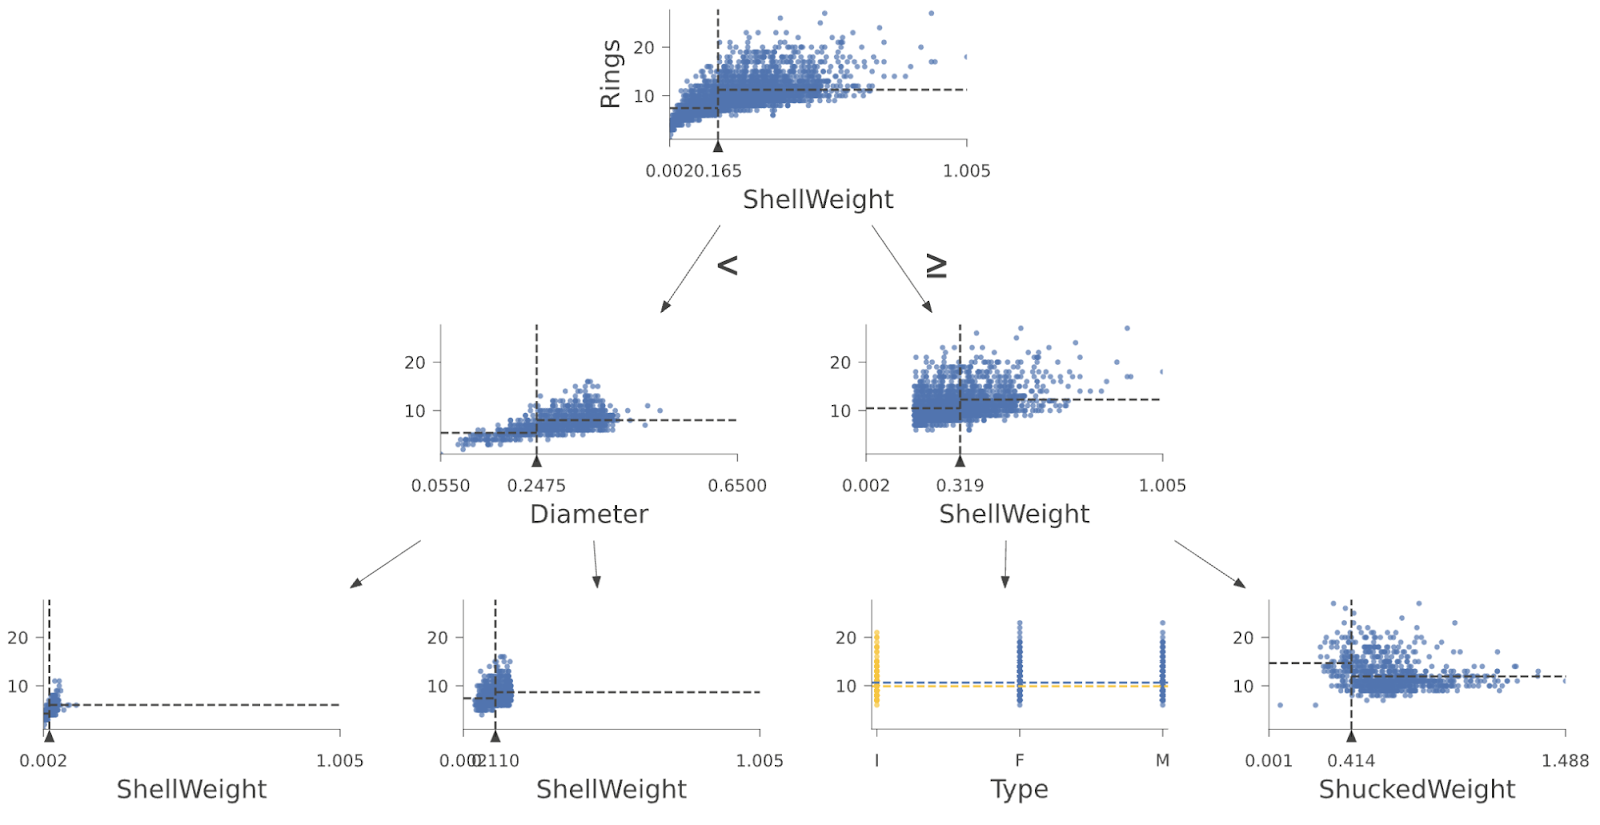
The power of dtreeviz lies in its ability to visualize the "why" behind the "what." It doesn’t just show the tree structure; it illustrates the distribution of training instances within each leaf and how individual decision nodes partition the feature domain.
Practical Application: The Penguin Dataset
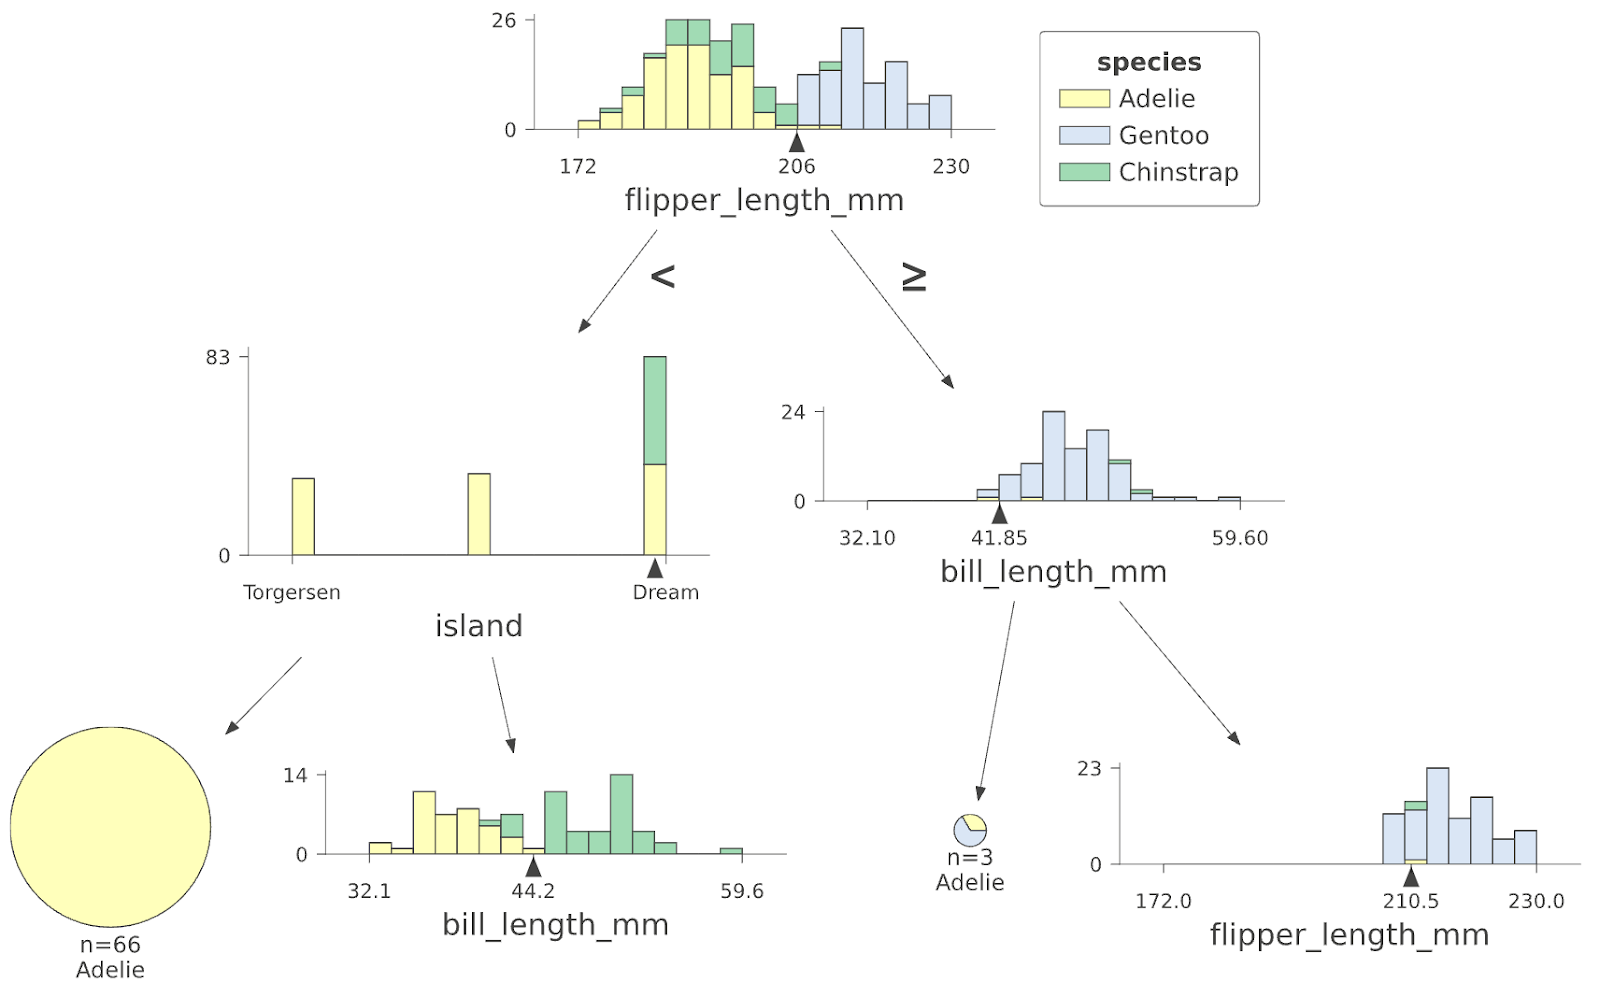
To illustrate the efficacy of the library, consider the famous Palmer Penguins dataset. When training a Random Forest to classify penguin species based on physical characteristics like flipper length and bill dimensions, dtreeviz creates a diagnostic visual.
The library allows developers to extract a specific tree from a forest and render its logic with minimal code:
# Extracting and visualizing a specific tree from a forest model
viz_cmodel = dtreeviz.model(cmodel,
                            tree_index=3,
                            X_train=train_ds_pd[penguin_features],
                            y_train=train_ds_pd[penguin_label],
                            feature_names=penguin_features,
                            target_name=penguin_label,
                            class_names=classes)
viz_cmodel.view()
By executing this, the developer sees not just the decision boundaries, but the density of the data points at each split. This allows for the immediate identification of overfitting or nodes that lack sufficient statistical support.
The Path to Prediction
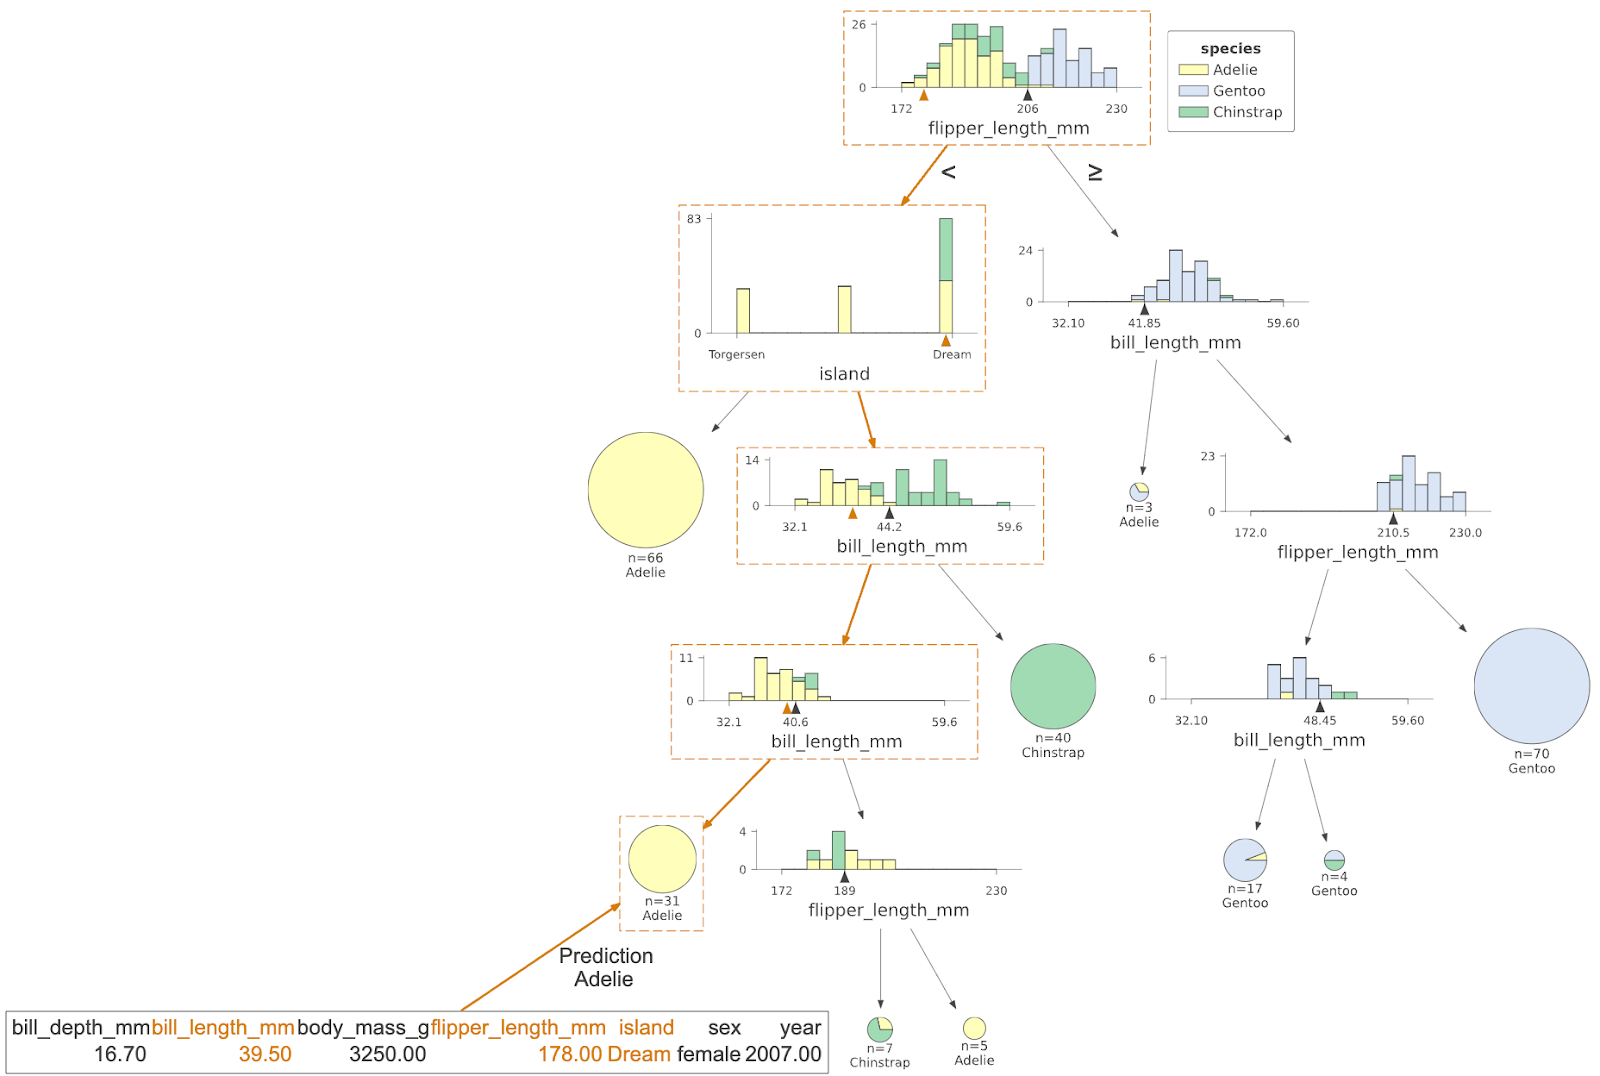
Perhaps the most impactful feature for end-users is the ability to trace a single, specific instance through the tree. In high-stakes environments—such as a bank rejecting a loan application—stakeholders need to know the specific variables that triggered the denial. dtreeviz highlights the path taken by the test instance in orange, clearly identifying which feature values (e.g., credit score or debt-to-income ratio) led to the final classification.
Furthermore, by calling viz_cmodel.ctree_leaf_distributions(), users can generate diagnostic plots comparing leaf IDs to samples-per-class, or for regressors, the distribution of target variables. These charts provide a "bird’s-eye view" of how the model segments the dataset, enabling engineers to refine their feature engineering process.
Official Responses and Industry Impact
The collaboration between the creators of dtreeviz (notably Terence Parr) and the TensorFlow team highlights a shift in industry priorities. Leading organizations are no longer content with "black box" models that achieve high accuracy; they require auditability.
"Visualization is essential," says Terence Parr, the creator of the library. His sentiment is echoed by the TensorFlow team, which now promotes dtreeviz as the standard tool for "interpreting TensorFlow Decision Forest Trees." By standardizing this library, Google is effectively providing a common language for data scientists to communicate model behavior to non-technical stakeholders, such as product managers or regulatory compliance officers.
Implications for Future Machine Learning
The integration of dtreeviz is not merely a convenience; it has profound implications for the future of AI development:
1. Enhanced Debugging and Model Tuning
Data scientists often struggle with models that perform well on training sets but fail in production. By using dtreeviz to visualize split points, engineers can catch "spurious correlations"—where a model relies on noise rather than signal. Identifying these issues visually is significantly faster than hunting through raw logs or feature importance weights.
2. Democratization of AI Ethics
As AI regulation becomes more stringent, the ability to "explain" a model’s decision is becoming a legal requirement. Whether it is in healthcare, finance, or hiring, the path to a decision must be transparent. Libraries like dtreeviz provide the documentation needed to prove that a model is not relying on protected or biased attributes, thus helping firms meet ethical AI standards.
3. Accelerated Educational Cycles
For students and practitioners, the visual representation of tree algorithms serves as a powerful educational tool. Watching how a tree partitions a feature space—moving from a root node to a final leaf—demystifies the underlying mathematics. The availability of resources like the Explained.ai article on the design of dtreeviz ensures that the next generation of data scientists understands the mechanics, not just the library calls.
Conclusion
The path from raw data to a final decision is rarely a straight line. As decision trees continue to dominate the tabular data space, the importance of tools that can parse and present this logic cannot be overstated.
By integrating dtreeviz into the TensorFlow ecosystem, Google has empowered the machine learning community to look under the hood of their models. Whether it is identifying the specific features that determined a penguin’s species or understanding the complex variables behind a loan rejection, dtreeviz offers the clarity required to move AI from a mysterious black box to a transparent, explainable, and reliable tool. For those building the next generation of intelligent systems, the message is clear: interpretability is not an afterthought—it is the foundation of trustworthy AI.